







-
 Redaction
The four quadrants of growth, inflation and rates
Discover how reflation, stagflation, and deflation shape interest rate cycles, and which assets historically outperform in each of the four economic quadrants.
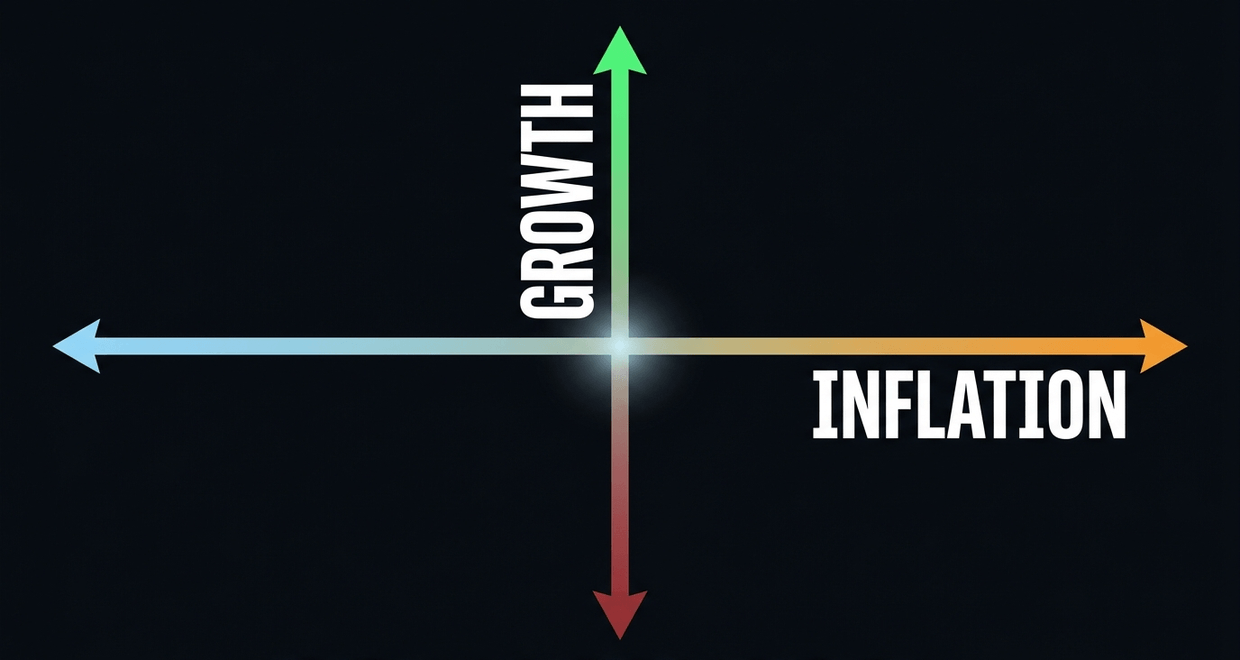
The global financial landscape functions as a complex, interconnected machine driven by two primary gears: economic growth and the rate of inflation. For the professional investor or the astute business leader, navigating this landscape requires more than a passing glance at headline data. It requires a systematic framework to decode the underlying mechanics of the business cycle. That framework is best visualized through a four-quadrant matrix mapping the trajectory of Gross Domestic Product (GDP) against the Consumer Price Index (CPI). By understanding where the economy sits within these quadrants, you can anticipate the path of central bank interest rates and the subsequent performance of various asset classes.
Economic cycles aren't random. They're the result of specific policy responses, consumer behaviors, and external shocks. Whether the economy is running hot in a reflationary boom or grinding through the agony of a stagflationary trap, each phase dictates a different set of rules for capital preservation and growth. Ignore these quadrants and you're sailing without a compass through a market defined by volatility.

Defining the four quadrants of the economic cycle
The framework itself isn't new. Versions of it trace back to Harry Browne's Permanent Portfolio and Geoffrey Moore's work at the National Bureau of Economic Research, but it was Bridgewater's Ray Dalio who popularized the modern growth/inflation matrix in the early 2000s, and firms like Gavekal and 42Macro have since built increasingly granular versions of it. The core insight hasn't changed: the rate of change in growth and inflation, not the absolute level, is what actually moves markets. That's a critical distinction. An economy growing at 2% with inflation falling from 4% to 3% behaves completely differently than one growing at 2% with inflation rising from 1% to 2%, even though the inflation print itself might look similar on paper.
Quadrant 1: The goldilocks environment
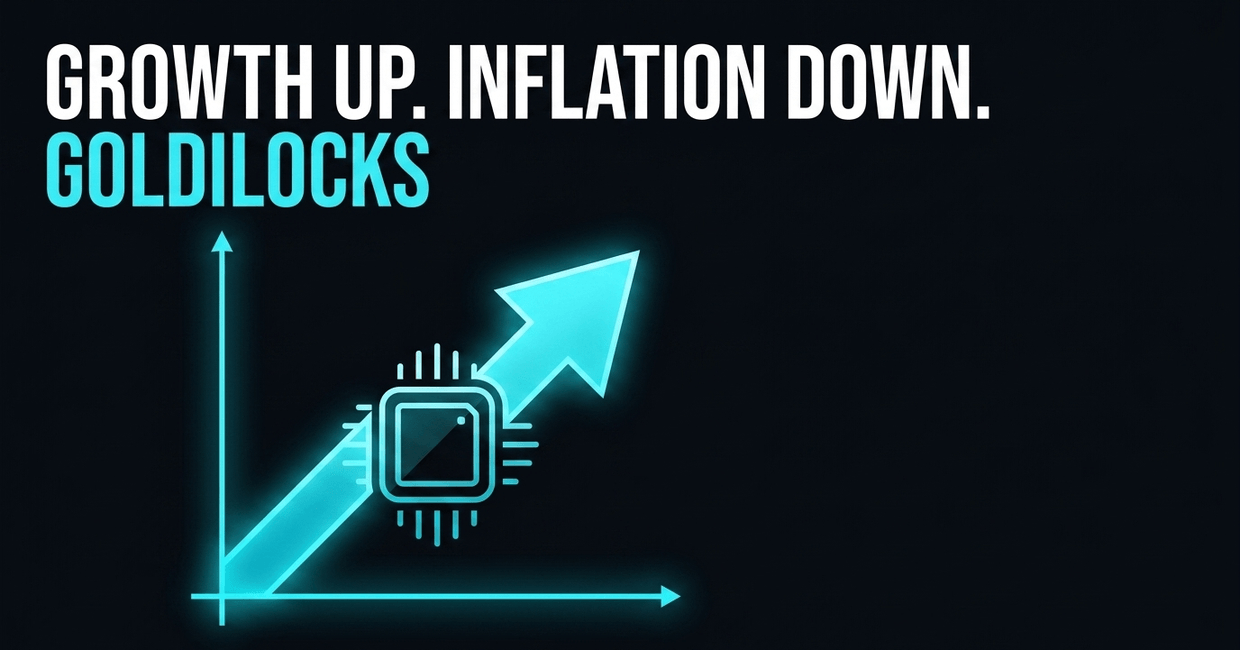
This phase is marked by accelerating growth and decelerating inflation. Traders call it lowflation, or disinflationary growth. It's the dream scenario for most market participants, because it allows corporate earnings to expand without forcing the central bank's hand toward aggressive tightening. Productivity tends to rise, consumer purchasing power holds steady, and equity markets get fertile ground to compound. This was roughly the texture of markets through much of the 1990s and again in the mid-2010s.
Quadrant 2: The reflationary phase
Reflation hits when both growth and inflation are accelerating together. It typically follows a downturn where fiscal and monetary authorities have flooded the system with liquidity. Early on, rising inflation gets waved off as a healthy sign of returning demand - and to be fair, it usually is. But as the quadrant matures, pressure builds on the central bank to start hiking before the economy overheats. The 2021 post-pandemic stretch is the textbook modern example: stimulus-fueled demand, a hot ISM index, and a Fed that waited longer than many economists wanted before acting.

Quadrant 3: The stagflationary trap
Stagflation is the nastiest environment for policymakers and investors alike. Growth decelerates while inflation keeps accelerating, usually on the back of a supply shock rather than excess demand. That distinction matters enormously, because it means the usual playbook doesn't work. Raising rates to fight inflation risks deepening the slowdown; cutting rates to support growth risks letting inflation run further out of control. There's no clean exit, only a series of trade-offs.
It's worth noting this isn't purely a historical curiosity. The Federal Reserve's own June 2026 policy statement acknowledged exactly this tension, noting that economic activity continues to expand at a solid pace even as inflation remains elevated relative to its 2 percent goal, "in part reflecting supply shocks that have driven price increases in certain sectors, including energy." With headline CPI running near 4.2% amid an energy-price shock tied to conflict in the Middle East, and the Fed's own projections showing slower growth alongside hotter inflation forecasts for the year, the stagflation quadrant isn't an abstraction. It's a live policy debate happening right now, which is exactly why this framework still earns its keep.
Quadrant 4: The deflationary contraction
In the fourth quadrant, both growth and inflation decelerate together. If inflation turns negative, you're in outright deflation. This usually follows a severe credit contraction or a collapse in aggregate demand - 2008 is the obvious reference point, and Japan's lost decades are the textbook cautionary tale. Falling prices sound nice to a consumer in isolation, but the second-order effects - falling wages, rising real debt burdens, declining asset values - tend to spiral into something far more dangerous than the headline number suggests.
The mechanics of inflation and its consequences
Inflation is more than rising prices on a shelf. It's a shift in the value of currency itself. Standard economic theory holds that mild inflation - the Fed's longstanding 2% target is the usual benchmark - signals a healthy, functioning economy. It nudges consumers to spend rather than hoard cash, keeping the gears of production turning.
The causes, though, are not uniform. Demand-pull inflation shows up when appetite for goods and services outruns the economy's ability to produce them - "too much money chasing too few goods," as the old phrase goes. This is a hallmark of the late-stage reflationary quadrant. Cost-push inflation is a different animal entirely, driven by rising input costs like energy or labor rather than excess demand. The 1970s oil shocks are the classic case, and they were a primary catalyst for that decade's stagflation. Research from institutions tracking business cycles consistently shows that supply shocks are harder to manage than demand-driven inflation precisely because they cut output and raise prices at the same time - there's no single lever that fixes both problems simultaneously.
Deflation is often the more dangerous mirror image. When prices fall, currency gains purchasing power, which sounds like good news until you watch what it does to behavior. If people expect prices to be lower next month, they defer purchases today. That kills corporate revenue, which triggers layoffs, which further dents demand. Once that "wait and see" mentality takes hold in the public consciousness, the deflationary spiral becomes brutally difficult to break.
Reflationary policies and the path to recovery
When an economy is stuck in recession or deflation, central banks and governments reach for reflationary tools. The goal isn't inflation for its own sake - it's getting the economy back to its long-term growth trend. These are calculated interventions, not blunt instruments, though they don't always feel that way in real time.
Monetary reflation means cutting interest rates toward zero and, in extreme cases, deploying quantitative easing - the central bank buying government bonds to flood the banking system with liquidity. Fiscal reflation works through government spending, often via infrastructure projects or tax cuts, to directly stimulate demand. The distinction between reflation and ordinary inflation comes down to starting point: reflation is a deliberate climb out of a hole, while inflation is simply the general state of rising prices during a normal expansion.
Stagflation and the policy dilemma
History gives this topic its teeth. The United States ground through a brutal stagflationary stretch from the early 1970s into the early 1980s, when unemployment stayed elevated while double-digit inflation chewed through the savings of the middle class. The term itself predates that era - British politician Iain Macleod coined "stagflation" in a 1965 speech to the House of Commons, telling Parliament: "We now have the worst of both worlds - not just inflation on the one side or stagnation on the other, but both of them together."
"We now have the worst of both worlds - not just inflation on the one side or stagnation on the other, but both of them together. We have a sort of 'stagflation' situation."
- Iain Macleod, House of Commons, 1965
Modern analysis generally points to supply-side constraints colliding with overly loose monetary policy as the root cause. When a central bank lets the money supply run too hot for too long while the economy faces real supply shortages - whether from an oil embargo, a war, or a pandemic-snarled supply chain - the result is a collapse in economic efficiency that no single rate decision can quickly fix. The Federal Reserve only broke the back of 1970s stagflation by raising interest rates to levels that look almost unbelievable today: the federal funds rate peaked near 19-20% in June 1981 under Chairman Paul Volcker, a move that deliberately triggered a deep recession to reset inflation expectations. Unemployment cleared 10% before it was over. It worked, but the price was steep, and that trade-off is precisely why stagflation terrifies policymakers more than almost any other economic condition.
The role of interest rates and the rate cycle
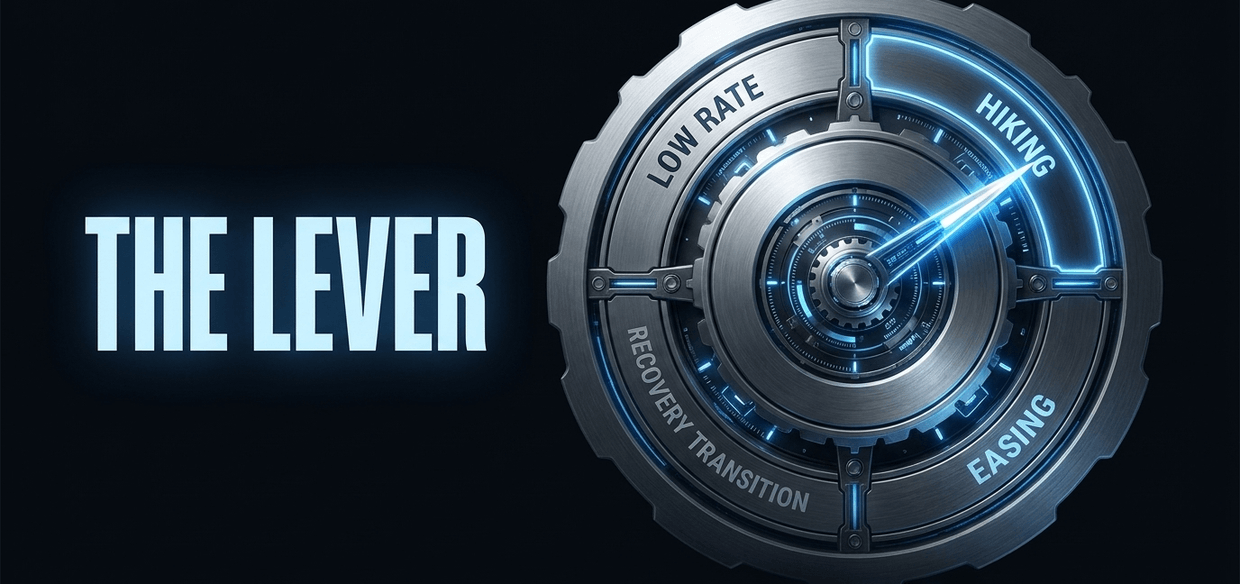
Central banks use interest rates as their primary lever to push the economy between quadrants. This movement is what creates the "rate cycle," and it's the thing serious investors track with the most precision. Raising rates is a hawkish move meant to cool an economy sitting in Quadrant 2 or 3 - by making borrowing more expensive, the central bank squeezes disposable income available for spending and investment, which should, in theory, ease inflationary pressure.
Lowering rates is the dovish counterpart, meant to nudge the economy out of Quadrant 4 and back toward growth. The rate cycle generally moves through four recognizable stages:
- The low-rate environment - established during a crisis to put a floor under the economy.
- The recovery transition - as growth returns, the central bank starts preparing markets for the end of easy money.
- The hiking cycle - rates rise incrementally, often producing a "bear flattening" of the yield curve as short-term rates climb faster than long-term rates on anticipation of a slowdown.
- The easing cycle - if the central bank overtightens and growth cracks, you get "bull steepening," where short-term rates fall rapidly as the bank scrambles to stabilize the economy.
The lag between a rate change and its real-world effect is one of the most underappreciated parts of this cycle. Milton Friedman's foundational research on "long and variable lags" found that monetary policy changes affect output faster than they affect inflation, with some studies estimating output effects materializing in roughly 12 to 18 months and the fuller inflation response taking closer to 18 to 24 months. That lag is exactly why central banks so often overshoot their targets - by the time the data confirms inflation has cooled, policy has frequently already tightened too far, accidentally pushing a healthy expansion into a painful contraction. It's also why markets obsess over forward guidance and dot plots rather than waiting for the lagging data itself.
Investment implications and asset allocation
Strategic asset allocation depends heavily on which quadrant the economy currently occupies. A portfolio built for reflation will get hammered in a stagflationary or deflationary environment, and vice versa - which is exactly why Bridgewater's "All Weather" approach exists: not to predict the quadrant, but to hedge against being wrong about it.
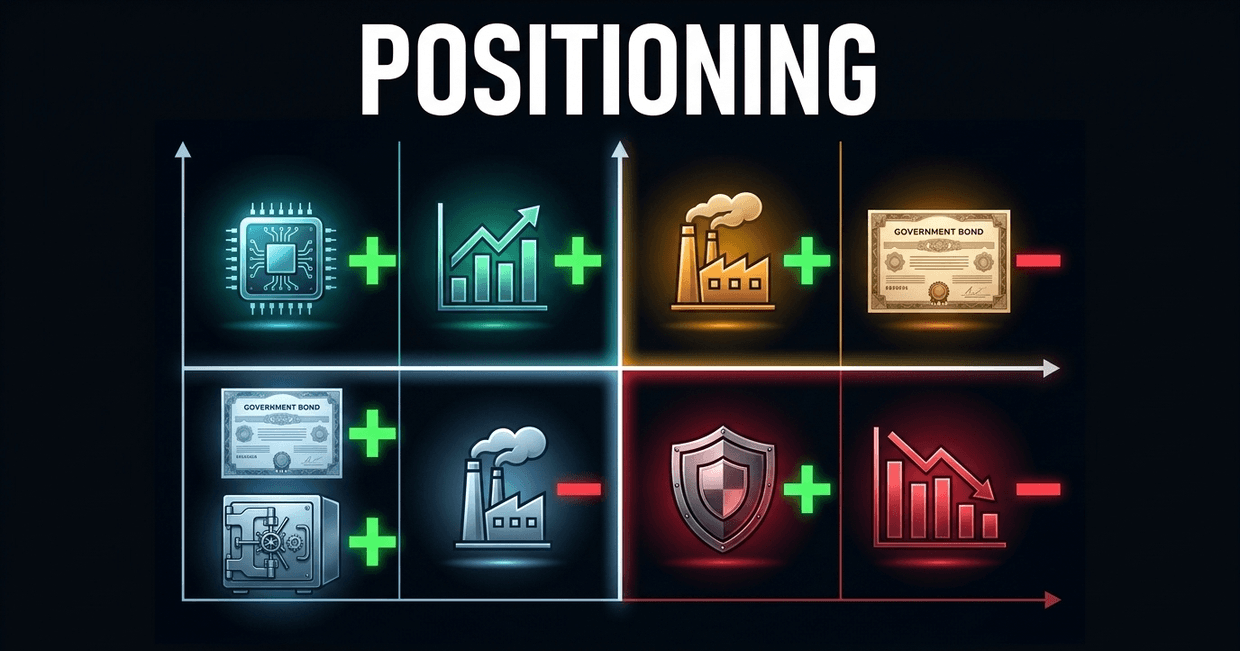
In the reflation quadrant (accelerating growth, accelerating inflation), cyclical stocks tend to lead - materials, industrials, and financials benefit from rising demand and the higher rates that typically accompany it. Investors generally trim exposure to long-dated bonds here, since rising yields mean falling bond prices.
In the stagflation quadrant (decelerating growth, accelerating inflation), there are genuinely few places to hide. Equities struggle broadly as rising costs eat into margins while higher rates discount future earnings more heavily. Liquidity becomes a premium asset in its own right. Treasury Inflation-Protected Securities (TIPS) and certain commodities can offer a partial hedge, but the overarching posture has to be defensive.
In the deflation quadrant (decelerating growth, decelerating inflation), cash is king and long-duration government bonds become the standout beneficiary - as inflation falls and the central bank cuts rates, the fixed coupon on a long bond becomes increasingly attractive. Equities tend to post weak nominal returns, though high-quality defensive names - healthcare, utilities, consumer staples - usually hold up better than the broader index.
In the goldilocks quadrant (accelerating growth, decelerating inflation), growth stocks and technology typically lead the tape. Low and falling inflation keeps a lid on interest rates, which disproportionately benefits companies whose value is weighted toward future earnings rather than current cash flow. This is the sweet spot most diversified equity portfolios are quietly built around.
Where the framework runs into trouble
No model survives contact with reality unscathed, and this one has real limitations worth naming. The matrix assumes growth and inflation move in relatively clean, identifiable cycles - but real economies get hit with shocks that scramble the picture: wars, pandemics, tariff regimes, technological step-changes like the current AI capital expenditure boom. Wellington Management's 2026 outlook, for instance, flagged that elevated equity valuations and tight credit spreads still look priced for a continuation of the noninflationary growth that characterized markets prior to 2018 - even while inflationary pressures from tariffs, energy, and AI-driven capex appeared to be building underneath. Quadrant calls are often only obvious in hindsight.
There's also the question of which inflation and growth measures to use, and over what time window. A quarter-over-quarter annualized read can put the economy in a different quadrant than a year-over-year comparison of the same data. Practitioners typically smooth this out using momentum indicators rather than single data points, but that introduces its own judgment calls about smoothing methodology. None of this makes the framework useless - it just means it's a lens for organizing probability, not a crystal ball.
Advanced models and evolving economic theories
While the traditional four-quadrant model remains a powerful starting point, modern finance has layered on more granular analytics. Firms like Hedgeye and 42Macro use momentum-based signals and cross-asset correlation indicators to try to identify quadrant shifts in real time, attempting to get ahead of official government data that's often released with a meaningful lag.
Academic research on the rate-inflation relationship itself has also evolved. Older studies generally found that a 1% rate hike could meaningfully reduce inflation over a one-to-two-year horizon, consistent with the long-and-variable-lag framework above. But the post-2020 inflation surge - first pandemic-driven, then complicated by geopolitical energy shocks - has reopened debate about how cleanly that relationship holds when the inflation in question is supply-driven rather than demand-driven. Higher rates do less to fix a war-driven oil price spike than they do to cool an overheated labor market, which is precisely the dilemma the Fed is wrestling with as of mid-2026, with policymakers explicitly noting current price pressures trace in part to energy-related supply shocks rather than excess demand.
Understanding these quadrants won't guarantee market success. But it gives you a logical foundation for decision-making instead of reacting to whatever headline crossed the wire this morning. The rate cycle behaves like a law of financial gravity - respect it and you find relative stability; ignore it and you're liable to get caught flat-footed in the wreckage of the next quadrant shift.
Share now








Key takeaways
- The growth/inflation matrix sorts the economy into four quadrants based on whether GDP growth and CPI inflation are accelerating or decelerating - not on their absolute levels.
- Quadrant 1 (Goldilocks): accelerating growth, decelerating inflation. Historically the strongest backdrop for equities, especially growth and technology stocks.
- Quadrant 2 (Reflation): growth and inflation accelerate together, typically following stimulus after a downturn. Favors cyclical sectors like materials, industrials, and financials.
- Quadrant 3 (Stagflation): growth decelerates while inflation keeps accelerating, usually driven by a supply shock rather than excess demand. Few asset classes perform well here.
- Quadrant 4 (Deflation): both growth and inflation decelerate, sometimes turning negative. Favors cash and long-duration government bonds.
- The term "stagflation" was coined by British politician Iain Macleod in a 1965 speech to the House of Commons, describing "the worst of both worlds."
- Under Fed Chairman Paul Volcker, the federal funds rate peaked near 19-20% in June 1981 to break 1970s stagflation, triggering a deep recession that pushed unemployment above 10%.
- Research on monetary policy "long and variable lags," dating back to Milton Friedman, finds that rate changes typically take roughly 12 to 18 months to fully affect output and 18 to 24 months to fully affect inflation.
- As of mid-2026, the Federal Reserve has explicitly cited energy-related supply shocks as a driver of inflation running above its 2% target even as growth holds up - a live, modern echo of the stagflation quadrant.
- The growth/inflation framework was popularized in modern form by Ray Dalio at Bridgewater Associates, building on earlier work by Harry Browne and NBER economist Geoffrey Moore.
Sources
- Wikipedia: Stagflation https://en.wikipedia.org/wiki/Stagflation
- Federal Reserve History: Recession of 1981-82 https://www.federalreservehistory.org/essays/recession-of-1981-82
- Federal Reserve Board - FOMC Statement, June 17, 2026 https://www.federalreserve.gov/newsevents/pressreleases/monetary20260617a.htm
- St. Louis Fed: Long and Variable Lags in Monetary Policy https://www.stlouisfed.org/publications/regional-economist/2023/may/examining-long-variable-lags-monetary-policy
- Wikipedia: Paul Volcker https://en.wikipedia.org/wiki/Paul_Volcker
- Published 2026-06-21 15:53
- Modified 2026-06-21 15:53

-
Redaction