

-
 PRO
PRO -
 Redaction
How shipping data predicts corporate earnings
Freight rates, port congestion, and rail carloads act as leading indicators for corporate margins. Discover how investors read the freight-rate signal
The global economy is a physical entity before it is a financial one. While equity analysts often focus on balance sheet ratios and consumer sentiment surveys, the most reliable indicators of future corporate performance are frequently found in the movement of physical goods. The freight-rate signal - a composite view of maritime and rail data - offers a forensic window into the future of corporate earnings. By tracking the cost and volume of movement across the world's primary trade arteries, investors can identify shifts in profitability roughly six months before they manifest in quarterly filings.
Historically, the supply chain was treated as a back-office utility, rarely mentioned in the C-suite. That changed when mentions of the term "supply chain" in S&P 500 earnings calls reached a ten-year peak in the third quarter of 2021. While these mentions retreated by late 2024 to approximately 10% of calls, the focus did not disappear; it evolved. Today, the conversation has shifted toward inventory management, reshoring, and the use of predictive logistics data to protect margins. This transition marks the institutionalization of supply chain analytics as a cornerstone of fundamental financial analysis.
The mechanics of the six-month predictive window
The utility of freight data as a leading indicator rests on the temporal lag between procurement and sale. When a manufacturer in North America or Europe orders raw materials or finished goods from overseas, freight costs are incurred at the point of origin or upon arrival at the port. These costs are typically capitalized into inventory and do not hit the Cost of Goods Sold (COGS) until the product is sold to the end consumer.

This accounting reality creates a predictive window. Changes in shipping rates or rail congestion today provide a roadmap for margin compression or expansion two to three quarters into the future. When the Freightos Baltic Index (FBX) - a benchmark for global container costs - spikes, it acts as a silent tax on future earnings for retail and industrial sectors. A decline in rates signals a potential easing of inflationary pressure on corporate margins. The reverse holds too, and it is worth stating plainly: the market rarely prices this lag correctly the first time.
Recent conditions illustrate why the signal has regained urgency. Container spot rates have been climbing again on several major lanes heading into the summer 2026 peak season. Shanghai-North Europe rates jumped sharply within a single week, and 40-foot rates from Shanghai to both the US west and east coasts rose 7%, reaching roughly $6,067 and $7,384 per container. On the FBX01 route specifically, tracking China and East Asia to North America's West Coast, the index sat near $7,550 per FEU in mid-July 2026. This is not a return to the extreme peaks of 2021, when the flagship FBX briefly approached $11,000, but it is a meaningful climb from the trough levels seen earlier in 2026 - and that delta is exactly the kind of movement analysts should be feeding into six-month margin models.
"Congestion remains very severe in Benelux and German ports, with delays of up to a week." - Linerlytica, cited in The Loadstar, July 2026
That quote is not decoration. Port delays of that magnitude are precisely the kind of input that, six months from now, shows up as either a margin beat or a margin miss on an importer's income statement.
Port congestion has become the dominant variable
Maritime data serves as the primary pulse of international trade, and in 2026 the story is congestion as much as it is price. Global port congestion climbed to a four-year high during the summer peak season, with more than 10% of the global fleet sitting at anchorage waiting for berths. The disruption is not confined to one region. In Shanghai, the world's busiest container port, ships have had to wait roughly three days, with dwell times running three to four days for exports and imports alike. Singapore has reported waiting times of around two days with similarly extended dwell periods.
European gateways have fared no better. Rotterdam and Antwerp have both dealt with severe inland barge disruption, and waiting times at some terminals have stretched toward four days. A heatwave compounded the problem in Rotterdam in July 2026, triggering temporary terminal stoppages on top of an already strained schedule. Meanwhile, the demand-supply imbalance underpinning all of this is structural rather than transient: global teu-mile demand growth has been running at roughly 7.3%, comfortably ahead of vessel supply growth near 5.4%.
This matters to earnings forecasting for a specific reason. When congestion rises, the "phantom demand" created by double-ordering and early booking often leads to a subsequent inventory glut, followed by a period of aggressive discounting that erodes corporate earnings. Tracking ship-to-shore movement times, then, is not a logistics curiosity - it is a real-time heat map of upcoming fiscal shocks for any retailer or manufacturer dependent on Asian imports.

Analysts should also watch blanked sailings as a related signal. Carriers have trimmed capacity on the Asia-North Europe corridor even as demand climbs, a combination that tends to precede further rate hikes rather than relieve them. When capacity gets pulled just as congestion peaks, the resulting rate pressure typically shows up in importer margins within two to three quarters.
Carrier earnings: the inverse indicator
Recent corporate performance among ocean carriers clarifies the signal from the other direction. Global container carriers recorded a combined EBIT of $15.4 billion in 2025, a significant decline from the $35.4 billion recorded in 2024, though the figure remains above pre-pandemic norms. That decline is not bad news for the broader economy - it is close to the opposite.
CMA CGM's first-quarter 2026 results made the mechanism visible. The carrier reported a 41.3% plunge in core EBITDA to $1.5 billion despite an increase in shipped volume, and average revenue per TEU fell 9.8% to $1,351. Lower freight rates were stripping away the windfall profits of the transport sector - and that compression is a tailwind for the companies that pay for shipping rather than provide it. When carriers report declining margins despite rising volumes, it is a signal that pricing power is shifting back to the shippers. That shift is bullish for corporate margins in the broader economy, even as it looks grim on a carrier's own income statement.

This dynamic is one reason freight analysts read carrier earnings calls almost as a contrarian indicator. A bad quarter for CMA CGM, Maersk, or Hapag-Lloyd, driven by falling per-unit revenue rather than falling volume, often foreshadows margin relief for retailers, apparel companies, and consumer electronics importers roughly two quarters out.
Rail data as a domestic demand barometer
If maritime data tracks the arrival of goods, rail data tracks their distribution and the health of the underlying industrial economy. In North America, the Surface Transportation Board and the Association of American Railroads (AAR) provide a granular, weekly look at the movement of commodities through carload and intermodal reports. This data remains one of the most undervalued tools in the earnings-prediction arsenal, largely because it updates weekly while earnings arrive quarterly.
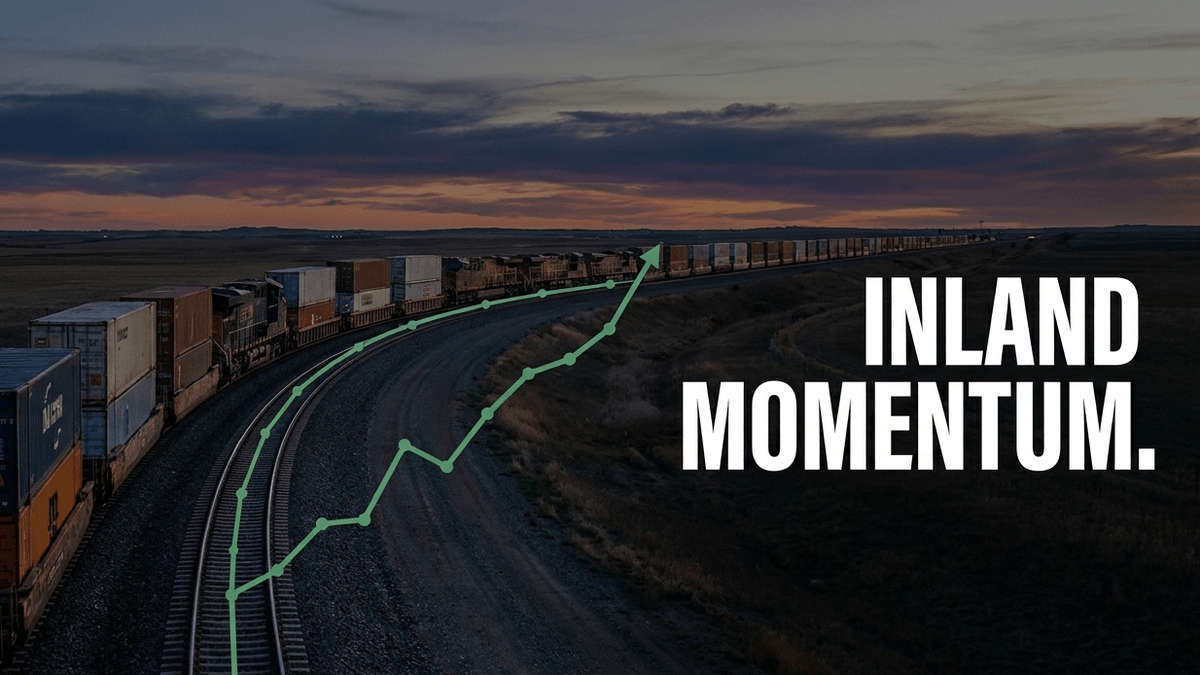
For the first 27 weeks of 2026, U.S. railroads reported cumulative volume of 6,117,342 carloads, up 3.1% from the same point in 2025, and 7,534,897 intermodal units, up 3.6% year over year. Total combined U.S. traffic for the period reached 13,652,239 carloads and intermodal units, a 3.4% gain over the prior year. Intermodal traffic, which represents the transfer of shipping containers from sea to land, has been particularly strong: several recent weeks logged double-digit annual gains, marking a sustained run of intermodal strength not seen in years. This synchronized growth across both carloads and intermodal traffic points to a resilient industrial base and a steady flow of consumer goods moving inland from the ports. When combined North American rail traffic is running this far ahead of the prior year, it suggests that broad-market earnings forecasts for the coming two quarters may prove too conservative.
However, volume does not always equate to profitability for the carriers themselves. Revenue for the U.S. rail transportation industry is projected to grow meaningfully in 2026, yet profit margins have been compressing over the same multi-year stretch, squeezed by higher diesel prices and lingering tariff pressures. The primary culprits are fuel costs and input pressures largely outside the railroads' control. This divergence - rising volumes but tightening margins for carriers - is a familiar pattern: it signals that value in the supply chain is shifting back toward the manufacturers and retailers benefiting from improved service reliability without the extreme surcharges seen earlier in the decade.
Grain and metallic ores have been standout categories in 2026's carload data, while motor vehicles and parts and coal have lagged. That commodity-level detail matters for sector-specific forecasting: a rail analyst modeling industrial earnings should weight grain and metals strength more heavily than the softer vehicle-carload trend when projecting sector-wide momentum.
If you're mapping capital flows more broadly across asset classes, the seasonal patterns explored in forex seasonality: map the calendar of capital flows offer a useful complement - freight cycles and currency repatriation flows often move on overlapping calendars.
Machine learning and the evolution of forecasting
Traditional linear models often fail to capture the nonlinear volatility of freight markets. Consequently, the industry has turned to machine learning to refine the six-month earnings signal. A systematic review of academic literature published between 2012 and 2024 identified nearly 60 input variables required to accurately model freight rates, ranging from GDP and inflation to fuel prices and the Baltic Dry Index.
Modern predictive models now leverage massive datasets, such as the roughly 500 million data points provided by platforms like Xeneta. These models use neural network frameworks and SHAP (Shapley Additive exPlanations) analysis to determine which factors are truly driving price movements. The findings across this research are consistent: lagged freight indices, interest rates, and port congestion rank among the most potent predictors of future shipping costs.
By integrating these ML-derived freight forecasts into equity valuation models, analysts can move beyond reactive reporting. A model that accurately flags a 10% rise in ocean freight rates in January can be used to trim earnings estimates for a major electronics retailer six months later. This level of foresight is no longer optional for institutional desks; it has become a baseline requirement for alpha generation in an increasingly volatile global market.

Strategic implications for corporate resilience
The correlation between supply chain strategy and enterprise value is now empirically documented. An analysis of over 1,000 earnings reports from mid-market companies between 2019 and 2025 revealed a stark divide. Companies that prioritized technology integration and real-time visibility saw their stock prices recover significantly faster after global disruptions. These proactive firms maintained better investor trust and were less susceptible to the "prolonged disruption" narrative that plagued their less-prepared peers.
Resilience is often built through inventory strategy. Many firms have shifted from "just-in-time" to "just-in-case" inventory models over the past several years. This carries higher holding costs, but it mitigates the earnings volatility caused by sudden freight-rate spikes. The ability of a company to absorb a 20% increase in shipping costs without passing it on to the consumer - or seeing margins evaporate - remains a primary differentiator in the current market environment.
Buffer stock strategy has become more concrete in practice. Where a traditional safety stock of two to three weeks was once standard for critical inventory categories, current conditions have pushed many shippers toward four to six weeks of buffer, particularly for goods moving through the most congested European and Asian gateways. That is a meaningful, measurable shift in working capital strategy, and it shows up directly in how companies report inventory turns and holding costs on the balance sheet.
Geopolitical and regulatory pressure on the signal
The freight-rate signal does not operate in a vacuum, and 2026 has offered a reminder of how quickly geopolitical events can distort it. Elevated risk around the Strait of Hormuz, alongside the continuing structural avoidance of the Red Sea corridor, has pushed a meaningful share of Asia-Europe traffic onto longer routings around the Cape of Good Hope. Longer routings mean more sailing days, more fuel burn, and tighter effective vessel supply - all of which feed directly into the rate and congestion inputs analysts rely on.
Regulatory shifts add another layer. The European Union's Carbon Border Adjustment Mechanism has moved into fuller enforcement, adding a distinct cost layer - separate from freight rates - onto goods entering the EU from carbon-intensive manufacturing regions. Tariff deadlines have also driven their own short-term distortions: exporters in Taiwan, for example, rushed shipments ahead of a tariff deadline in July 2026, temporarily tightening capacity and driving vessel waiting times higher across regional terminals. Analysts using freight data as a leading indicator need to separate these one-off, deadline-driven surges from genuine demand growth, or risk mistaking a rush for a trend.
Actionable steps for using freight data in financial analysis
To effectively use the freight-rate signal, analysts and investors should adopt a structured approach to data integration. This involves moving from macroeconomic generalizations to specific, trackable metrics.
- Monitor the moving average of North American rail carloads and intermodal units. A sustained move of 2% or more above the prior year, sustained across multiple consecutive weeks rather than a single data point, is a meaningful signal for domestic industrial earnings growth.
- Track the FBX and comparable indices with a six-month offset. Compare current rate trends against the historical margin profiles of import-dependent sectors like retail, apparel, and consumer electronics.
- Analyze shipping carrier EBITDA trends. When carriers report declining margins despite rising volumes, it indicates a shift in pricing power back to the shippers - a bullish signal for corporate margins in the broader economy.
- Utilize port congestion data as a lead-time indicator for inventory builds. High congestion today suggests an earnings-dampening inventory surplus roughly six months from now, followed by margin-eroding discounting.
- Separate deadline-driven demand spikes from organic growth. Tariff deadlines and front-loading ahead of regulatory changes can distort short-term freight data; weight these periods differently than steady-state demand signals.
In conclusion, the physical economy provides the data necessary to navigate the financial one. The movement of freight is not merely a logistical concern; it is a leading indicator of the capital flows that define corporate success. By mastering the freight-rate signal - and by staying current on the congestion, carrier, and rail data that feed it - the professional investor gains a meaningful head start in predicting the winners and losers of the next earnings cycle.
Share now









Key takeaways
- Freight costs are typically capitalized into inventory and don't hit Cost of Goods Sold until a product sells, creating a two-to-three quarter lag between shipping-rate moves and their appearance in earnings.
- Global port congestion climbed to a four-year high in mid-2026, with more than 10% of the global container fleet waiting at anchorage during peak season.
- Shanghai and Singapore, the world's two busiest container ports, have both reported vessel waiting times of two to three days, with dwell times running as high as four days for exports.
- On the FBX01 route (China/East Asia to North America West Coast), the index stood near $7,550 per FEU in mid-July 2026 - well below the 2021 peak of roughly $11,000, but climbing.
- Global container carriers recorded a combined EBIT of $15.4 billion in 2025, down sharply from $35.4 billion in 2024, though still above pre-pandemic norms.
- CMA CGM's core EBITDA fell 41.3% to $1.5 billion in Q1 2026 despite higher shipped volume, as average revenue per TEU dropped 9.8% to $1,351.
- Falling carrier margins despite rising volumes signal that pricing power is shifting back to shippers - a bullish indicator for downstream corporate margins.
- U.S. railroads moved 6,117,342 carloads and 7,534,897 intermodal units in the first 27 weeks of 2026, up 3.1% and 3.6% year over year respectively.
- Global teu-mile demand growth (around 7.3%) has been outpacing vessel supply growth (around 5.4%), a structural imbalance supporting elevated rates.
- Machine learning models trained on datasets of up to 500 million data points use SHAP analysis to identify lagged freight indices, interest rates, and port congestion as the top predictors of future shipping costs.
- Many shippers have extended critical-inventory buffer stock from the traditional two-to-three weeks to four-to-six weeks in response to persistent congestion.
- Regulatory shifts, including the EU's Carbon Border Adjustment Mechanism and tariff-deadline front-loading, add cost and volume distortions separate from underlying freight rates.
Sources
- The Loadstar https://theloadstar.com/rate-rises-loom-as-port-congestion-hits-four-year-high/
- Freightos Terminal (FBX) https://www.freightos.com/enterprise/terminal/freightos-baltic-index-global-container-pricing-index/
- FreightWaves https://www.freightwaves.com/news/worlds-third-largest-shipping-line-sees-q1-earnings-crash
- Association of American Railroads https://www.aar.org/news/aar-reports-weekly-rail-traffic-for-the-week-ending-june-27-2026/
- Surface Transportation Board https://www.stb.gov/reports-data/economic-data/
- Published 2026-07-20 00:14
- Modified 2026-07-20 00:14

-
Redaction