

-
 Redaction
Phillips Curve explained: Inflation and jobs
Explore how the Phillips Curve links unemployment and inflation - from A.W. Phillips' 1958 origins to NAIRU, expectations theory, and modern monetary policy.
The relationship between jobs and prices sits at the heart of modern economic policy. Whether a central bank raises interest rates, holds steady, or cuts - the Phillips Curve is almost always somewhere in that decision. Yet for most people outside economics, the concept remains abstract, even mysterious.
This guide breaks it down clearly: what the Phillips Curve is, how it evolved, why it flattened for decades, and why it appears to be steepening again - with real consequences for inflation, mortgages, wages, and the cost of everyday life.
The historical foundations of the Phillips Curve
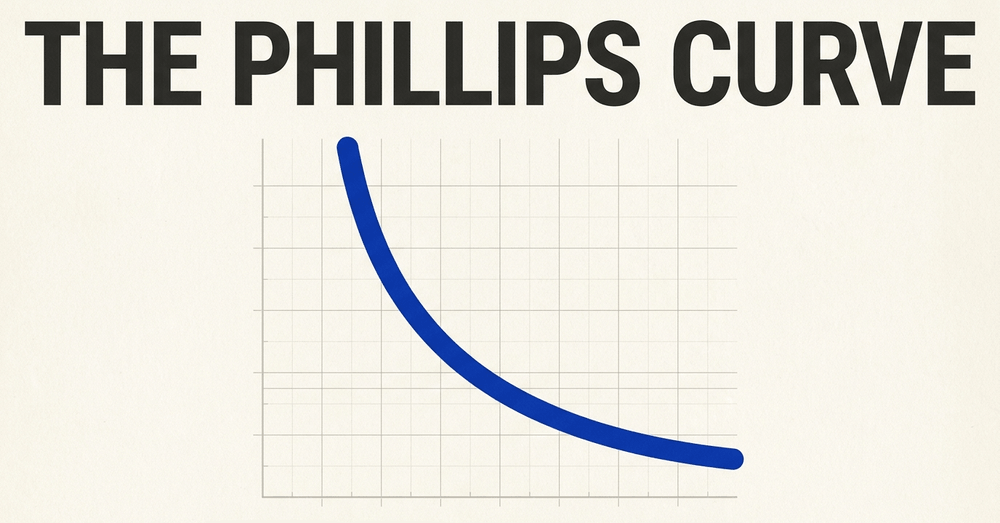
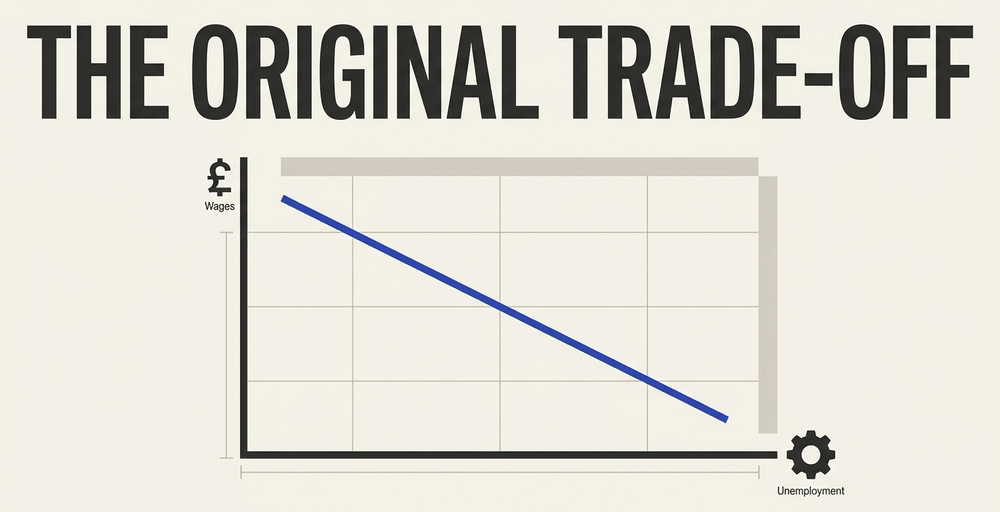
The story begins in 1958, when New Zealand-born economist A.W. Phillips published a landmark study of the UK economy. He analyzed nearly a century of data - from 1861 to 1957 - and documented a consistent inverse relationship between the unemployment rate and the rate of change in money wages.
The logic was intuitive. When labor is scarce, firms compete aggressively to hire workers, pushing wages upward. When unemployment is high, workers accept lower wage growth rather than risk joblessness. Phillips had put a formal framework around something economists had long suspected.
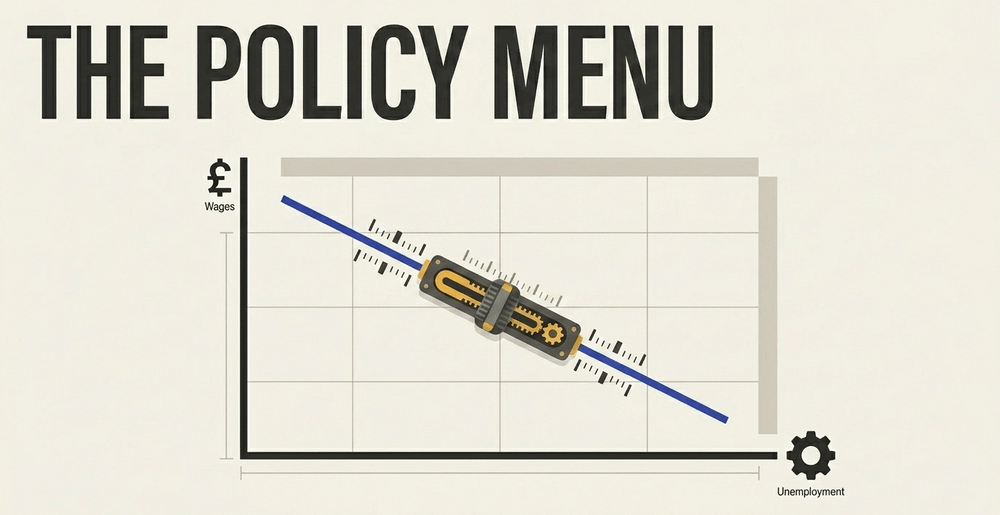
Paul Samuelson and Robert Solow quickly extended the idea. Rather than just wages, they applied it to general consumer price inflation - transforming Phillips' finding into a policy menu. Under this framework, policymakers could theoretically choose their preferred point on the curve:
- Accept higher inflation to keep unemployment low
- Accept higher unemployment to keep inflation under control
This trade-off defined macroeconomic thinking for much of the 1960s, giving governments and central banks what appeared to be a navigable path between two of their most important policy objectives.

How the short-run Phillips Curve works
The Short-Run Phillips Curve (SRPC) captures what happens in the economy before wages and prices have had time to fully adjust to new conditions. This stickiness is real and well-documented - it arises from multi-year labor contracts, menu costs for businesses, and the simple fact that information spreads unevenly through markets.
When aggregate demand rises, firms ramp up production and hire more workers. As unemployment falls, competition for labor intensifies, wages rise, and firms eventually pass those higher costs on to consumers through price increases. The curve traces this dynamic: lower unemployment correlates with higher inflation, at least temporarily.
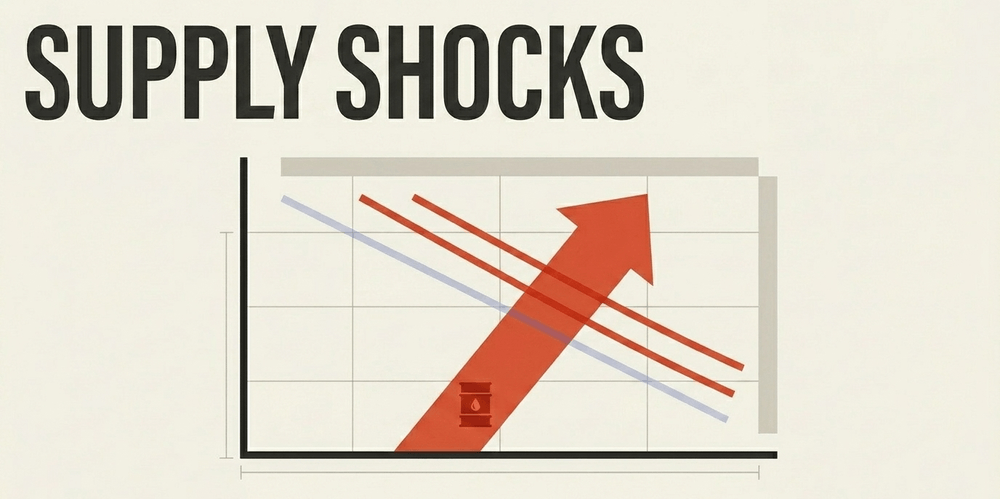
Critically, the curve itself can shift. It does not just move along a fixed line. Two forces are particularly powerful:
- Supply shocks - a sudden spike in energy prices, for instance, pushes the entire curve upward, generating more inflation at every level of unemployment
- Inflation expectations - if people expect higher future prices, they demand higher wages today, which feeds directly into actual inflation
This second mechanism - expectations - proved to be the intellectual crack that would eventually reshape the entire framework.
The long-run perspective and the emergence of NAIRU
By the late 1960s, serious cracks had appeared in the original model. Milton Friedman, in his famous 1968 presidential address to the American Economic Association, and Edmund Phelps independently in a 1967 paper, delivered a fundamental challenge to the idea of a permanent inflation-unemployment trade-off.
Their argument rested on money illusion - the tendency of workers to confuse nominal wage increases with real gains in purchasing power. In the short run, workers might accept a wage rise of 4% as a genuine improvement, even if inflation is running at 4%, leaving their real purchasing power unchanged. But over time, workers learn. They adjust their wage demands to reflect actual inflation, eliminating any unemployment reduction the expansionary policy achieved.
"In the long run, there is no trade-off between inflation and unemployment. Any attempt to hold unemployment below its natural rate will simply produce ever-accelerating inflation."
- Friedman-Phelps natural rate hypothesis, 1967-1968
This insight produced the Long-Run Phillips Curve (LRPC): a vertical line. In the long run, the economy returns to its structural unemployment rate regardless of inflation. That point is known as the Non-Accelerating Inflation Rate of Unemployment, or NAIRU.
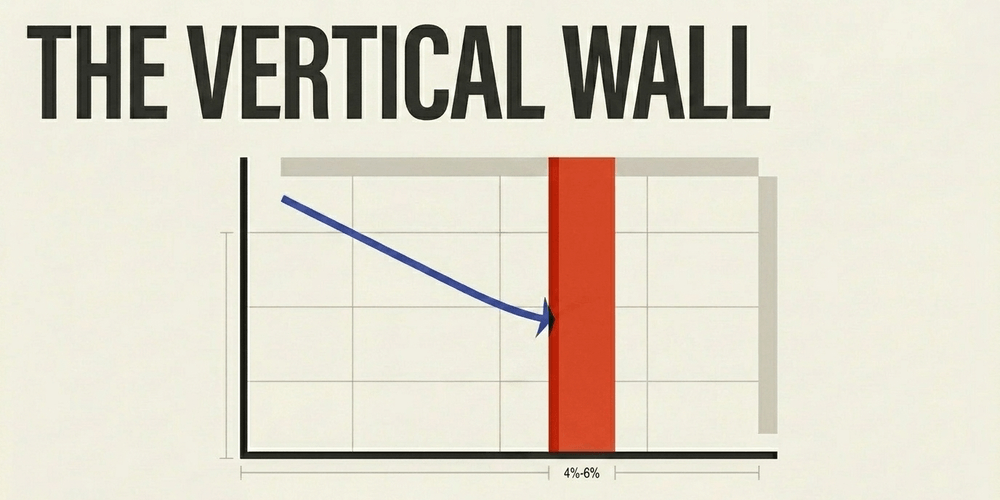
NAIRU is not fixed. It reflects the underlying structure of the labor market - how easily workers move between jobs, how well skills match available positions, and how efficiently hiring and firing can occur. Key estimates over time:
- In the latter half of the 20th century, US NAIRU was estimated at 5% to 6%
- Following the 2008 financial crisis, revised estimates pushed the figure below 4%, as the labor market demonstrated it could tighten substantially without immediately triggering inflation
NAIRU cannot be directly observed in real time, which creates persistent uncertainty for policymakers relying on it.
Expectations-augmented models and why trust matters
The modern version of the framework - the expectations-augmented Phillips Curve - incorporates the Friedman-Phelps insight directly. Current inflation is not just a function of how tight the labor market is. It also depends heavily on what workers, firms, and consumers expect inflation to be in the future.
The mechanism is self-fulfilling. If a workforce collectively expects 5% inflation, workers negotiate for at least 5% wage increases to protect their living standards. Higher wage costs raise production expenses. Firms pass those costs on as higher prices. The original 5% expectation becomes a 5% reality.
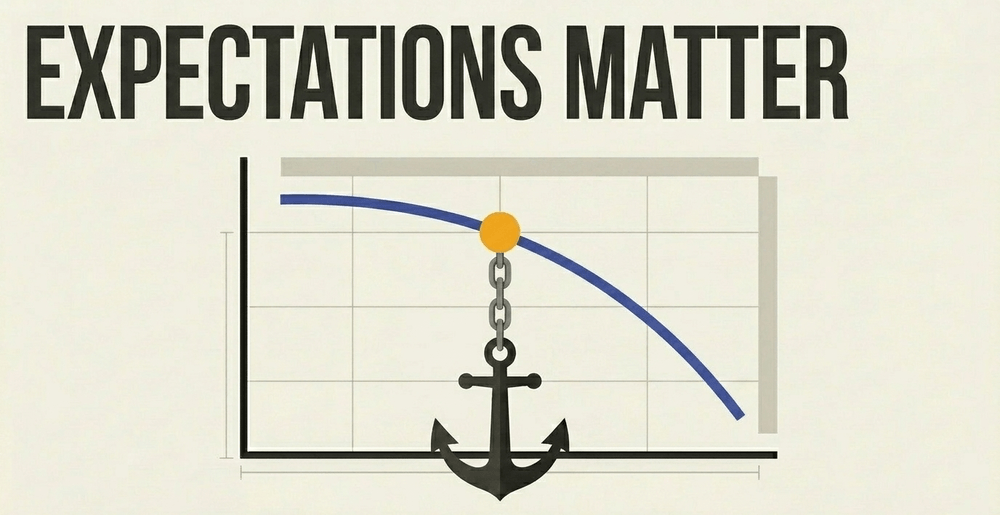
This is why anchored inflation expectations are among the most closely guarded assets of any central bank. Both the Federal Reserve and the European Central Bank monitor survey-based and market-derived inflation expectations continuously - not as a curiosity, but as a primary diagnostic of whether their credibility remains intact.
When expectations are well-anchored, the curve remains more predictable and the policy trade-off more manageable. When they become unanchored, the curve can shift sharply and unpredictably - making it far harder to restore stability without causing meaningful damage to employment.

The wage-price spiral: second-round inflation effects
Of all the mechanisms the Phillips Curve captures, few are as consequential - or as difficult to arrest - as the wage-price spiral.
It unfolds in stages. Rising consumer prices erode purchasing power, prompting workers to demand higher nominal wages. Higher wages raise production costs for businesses, which then pass those costs on through further price increases. The cycle reinforces itself.
Economists classify this as a second-round inflation effect:
- First-round effects are the direct, initial price increases from a supply shock or demand surge
- Second-round effects materialize when those price increases embed themselves in wage expectations and long-term labor contracts, transforming a temporary episode into persistent structural inflation
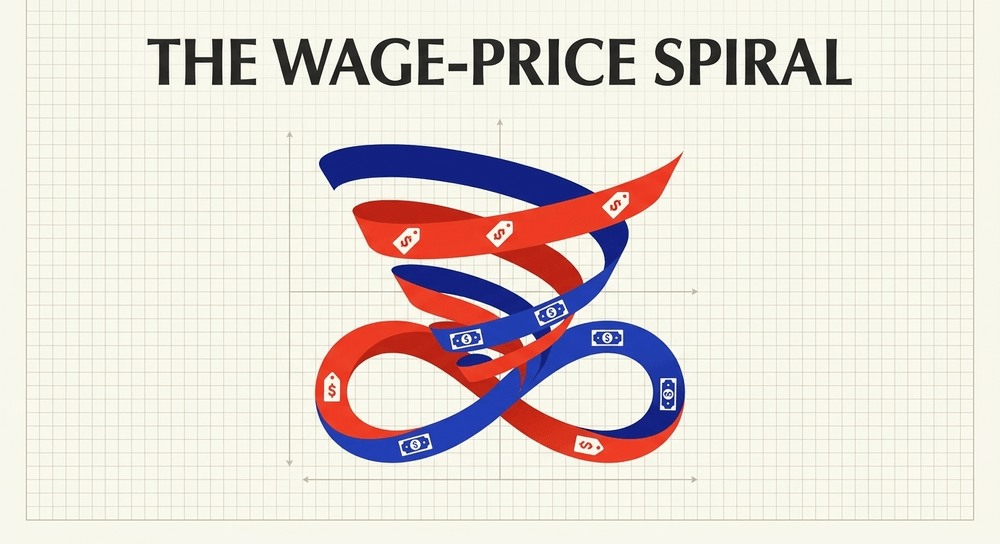
The most instructive historical example remains the 1970s. A combination of oil price shocks, insufficiently restrictive monetary policy, and deeply unanchored inflation expectations created a feedback loop that proved extremely difficult to break. It took the aggressive rate-hiking campaign of Federal Reserve Chair Paul Volcker - pushing the US unemployment rate above 10% - to durably restore price stability. The Volcker disinflation of the early 1980s stands as a sobering demonstration of how costly it becomes when inflation expectations are allowed to drift away from a credible anchor.
The flattening of the curve: 1980s to 2019
For roughly four decades after the Volcker disinflation, the Phillips Curve appeared to lose much of its predictive power. Research suggests the sensitivity of inflation to changes in unemployment was roughly halved between the early 1980s and 2007.
Several explanations emerged:
- Better-anchored expectations: The Fed's hard-won credibility after the Volcker era meant workers and firms trusted that inflation would remain low, reducing second-round effects
- Globalization: Competition from low-cost international suppliers constrained firms' ability to raise prices, even in a tight domestic labor market
- Technological change: Productivity gains muted cost pressures even as wages rose
- Labor market shifts: The growth of services, the decline of unionization, and changes in wage-setting dynamics all reduced the pass-through from employment to prices
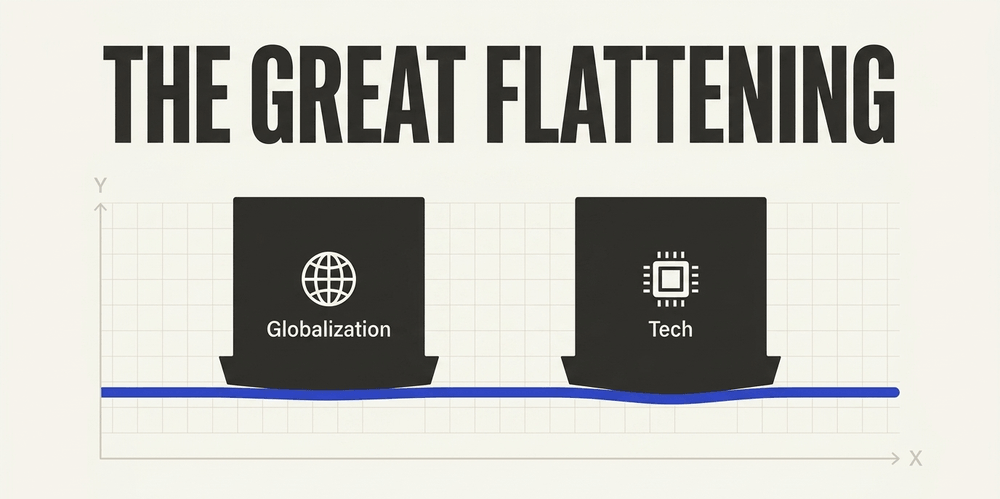
After the 2008 financial crisis, some researchers argued the relationship had effectively disappeared. The United States experienced unemployment falling to historic lows - below 4% - without triggering the inflation surge the traditional framework would have predicted. The curve seemed to be bent rather than simply flat: relatively inert when unemployment was elevated, but potentially steepening sharply only at extreme labor market tightness.
The post-pandemic steepening: what happened after 2021
The COVID-19 pandemic and its economic aftermath have substantially challenged the flattening thesis.
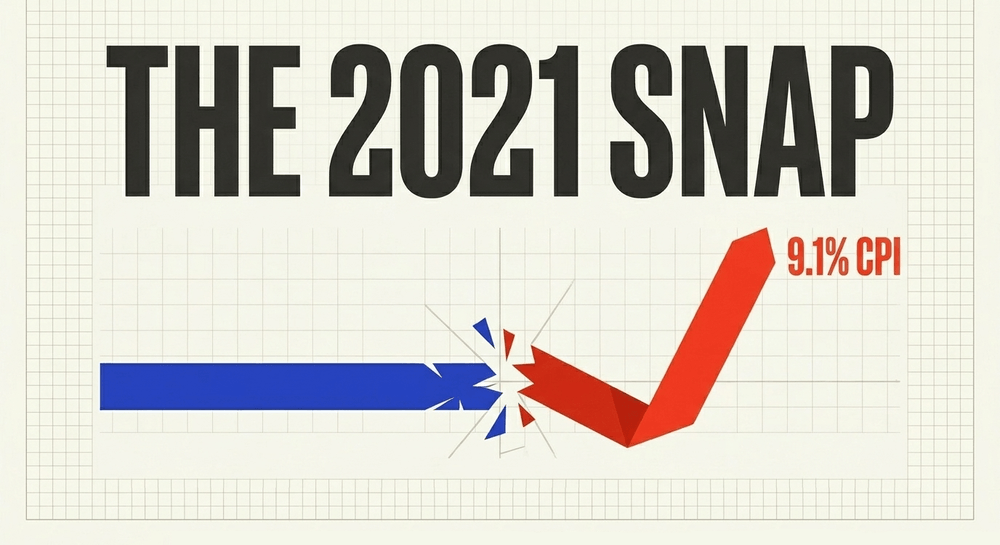
Across many industrialized nations, evidence now points to a clear steepening of the curve. In June 2022, US CPI inflation peaked at 9.1% - a 40-year high - while the unemployment rate remained near historic lows of approximately 3.5% to 3.7%. The simultaneous extreme tightness in the labor market and extreme elevation in prices reflected a Phillips Curve dynamic operating with renewed intensity.
Several factors contributed to this steepening:
- Supply chain disruptions created cost pressures that bypassed the usual dampening mechanisms
- Enormous fiscal stimulus supercharged aggregate demand in a supply-constrained economy
- Firms repricing more frequently: With disruptions forcing constant price adjustments, the price stickiness that had previously muted the short-run relationship was reduced
- Labor market structural changes: Retirements, reduced immigration, and shifting worker preferences tightened labor supply faster than demand could accommodate
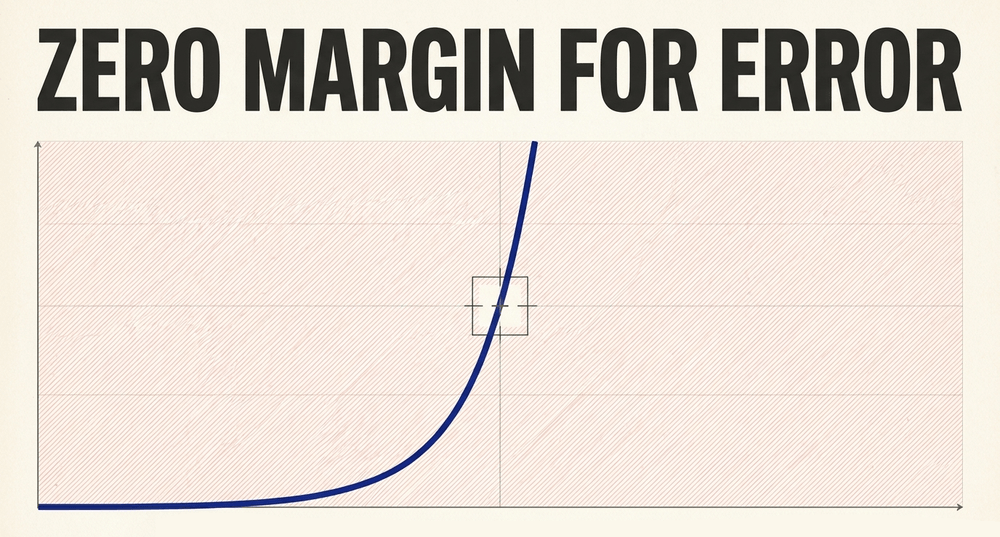
The policy implication is significant. If the curve is genuinely steeper in the current regime, central banks have materially less room for error than was widely assumed during the 2010s. An overheating labor market could generate substantially higher inflation than historical averages would predict, requiring more aggressive interest rate responses to restore equilibrium.
What this means for everyday consumers and investors
The Phillips Curve is not just an academic construct. Its slope and position shape decisions that affect household finances directly.
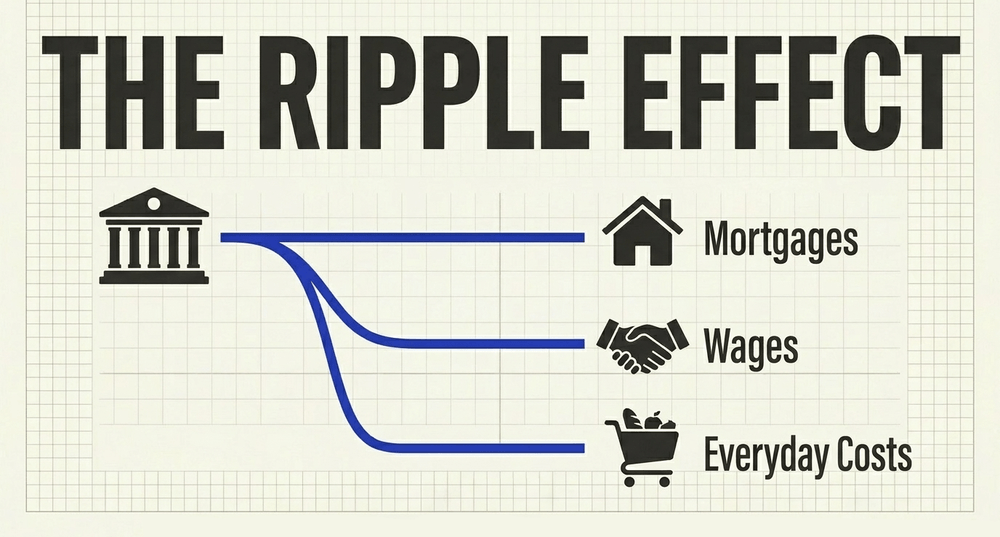
For mortgage holders and borrowers: When central banks detect the economy running below NAIRU - meaning unemployment is too low relative to the natural rate - they typically raise interest rates to cool demand and ease inflationary pressure. Higher rates feed directly into mortgage rates, auto loan costs, and business borrowing.
For workers and wage negotiations: A tight labor market, consistent with a position on the left side of the Phillips Curve, gives workers greater bargaining power. Understanding where the economy sits relative to NAIRU helps contextualize whether current wage growth is likely to persist or be moderated by policy tightening.
For investors: The curve's current slope affects expectations for future interest rate paths. A steeper curve means inflation can rise faster than models suggest when unemployment is low - which typically implies more aggressive central bank tightening and downward pressure on bond prices.
For businesses: Firms making multi-year pricing, hiring, or capital investment decisions need a view on whether the current inflation environment is transitory or structural - precisely the question the expectations-augmented Phillips Curve is designed to help answer.
Cross-country evidence and global applications
The Phillips Curve is not an exclusively American framework. Central banks worldwide incorporate inflation-unemployment dynamics into their forecasting models, though with considerable variation in calibration.
In the Eurozone, the curve's behavior has historically been complicated by structural heterogeneity across member states. Countries with more flexible labor markets tend to exhibit a tighter inflation-unemployment relationship, while economies with rigid wage-setting institutions show weaker pass-through. The ECB's challenge of setting a single interest rate for a structurally diverse monetary union means aggregate Phillips Curve dynamics can mask significant divergence at the national level.

Japan presents one of the most analytically challenging cases. Despite decades of extremely low unemployment, the country struggled persistently with deflation - a puzzle that confounded standard predictions. Economists attribute this to deeply entrenched deflationary expectations, adverse demographic trends, and structural rigidities in the labor market that suppressed wage growth even under tight conditions. The Bank of Japan's prolonged experiments with yield curve control and unconventional monetary easing were explicitly designed to dislodge these expectations.
Emerging economies introduce further complexity. In countries with weaker institutional frameworks, significant import dependency, or large informal labor sectors, the relationship between domestic unemployment and consumer prices is frequently overwhelmed by exchange rate pass-through effects and global commodity price volatility.
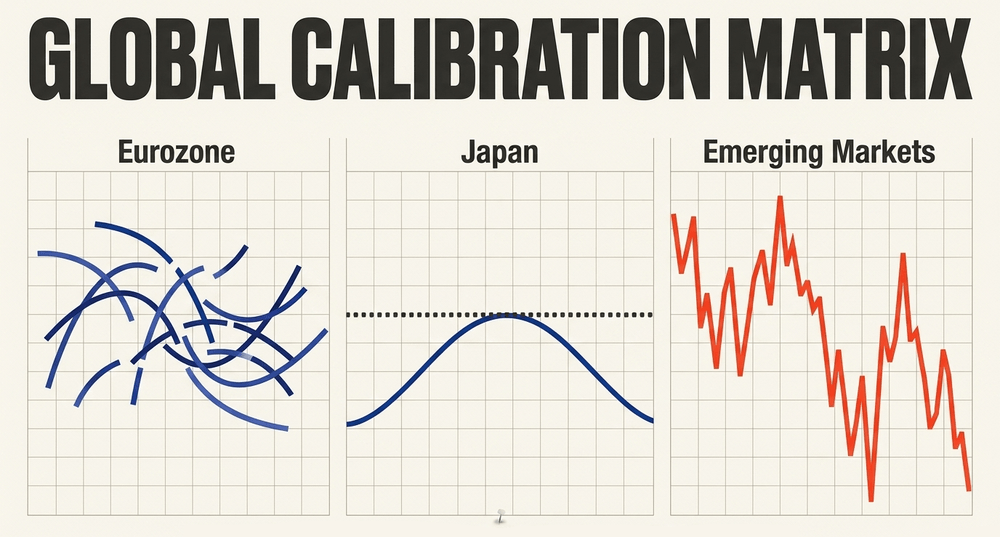
This cross-country heterogeneity underscores a fundamental lesson: the Phillips Curve is not a universal law. It is a framework, whose quantitative parameters must be calibrated to the specific institutional and structural context of each economy.
Criticisms and known limitations
Despite its enduring influence, the Phillips Curve attracts substantial criticism from economists across the theoretical spectrum.
Structural instability is the most persistent objection. The curve's slope, and at times even its direction, shifts considerably across different time periods and policy regimes. A relationship this sensitive to structural conditions cannot reliably anchor a systematic policy rule. The repeated re-estimation of NAIRU - an inherently unobservable variable - introduces significant uncertainty into any framework built around it.
Limited causal scope is another serious concern. Traditional Phillips Curve specifications focus primarily on labor market slack as a driver of inflation. They may inadequately capture:
- Global supply chain dynamics
- Import price pass-through
- Corporate pricing power and market concentration
- The role of large-scale fiscal stimulus
- Structural shifts driven by technology or demographics
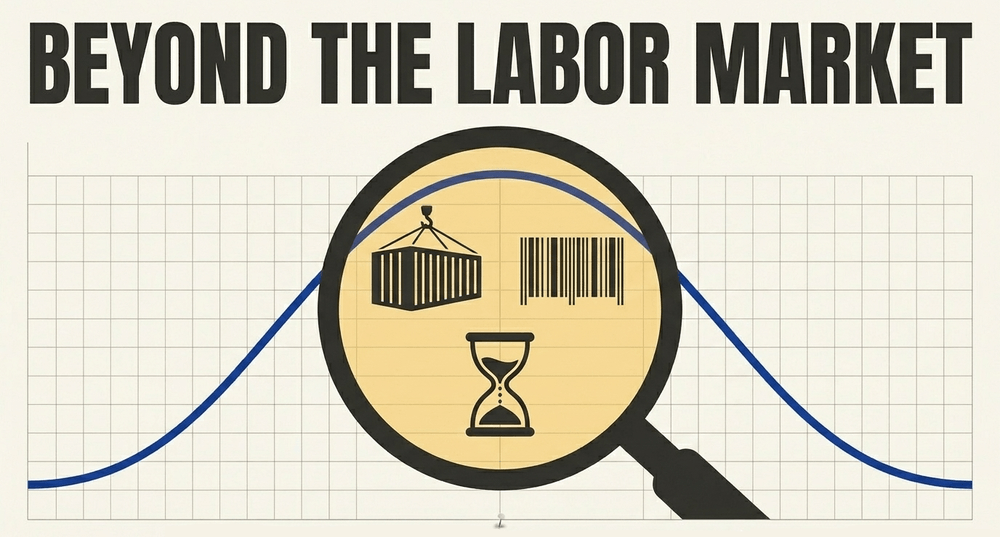
Some economists argue that the post-pandemic inflation episode was driven predominantly by supply-side dysfunction rather than conventional demand-pull pressure, suggesting the framework offered only a partial explanation of events.
Rational expectations theorists go further. If private agents understand the central bank's reaction function and adjust their expectations accordingly, any attempt to systematically exploit the inflation-unemployment trade-off becomes self-defeating by design. The expected policy move is priced in before it occurs.
Nonetheless, most mainstream macroeconomists treat the Phillips Curve not as a precise empirical law, but as a useful and robust approximation - one that captures important tendencies in the data even as its quantitative parameters evolve over time.
Practical implications for modern monetary policy
Despite ongoing debates about its stability, the Phillips Curve remains an indispensable conceptual tool for central banking in 2026.
The Federal Reserve operates under a dual mandate: maximum sustainable employment and stable prices. The Phillips Curve provides the analytical bridge between these two objectives. When the economy operates below NAIRU, the Fed must weigh the near-term benefits of high employment against the medium-term risk of accelerating inflation. When unemployment rises above NAIRU, the curve helps estimate how much disinflationary pressure will emerge over the forecast horizon.
The unemployment gap - the difference between the actual unemployment rate and NAIRU - remains a meaningful driver of price dynamics, even as the sensitivity of that relationship varies across cycles.
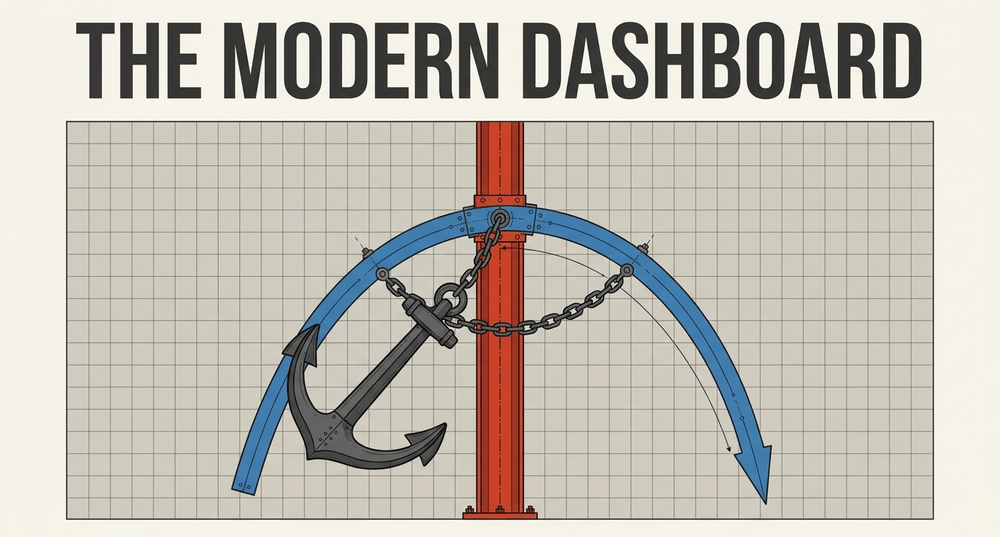
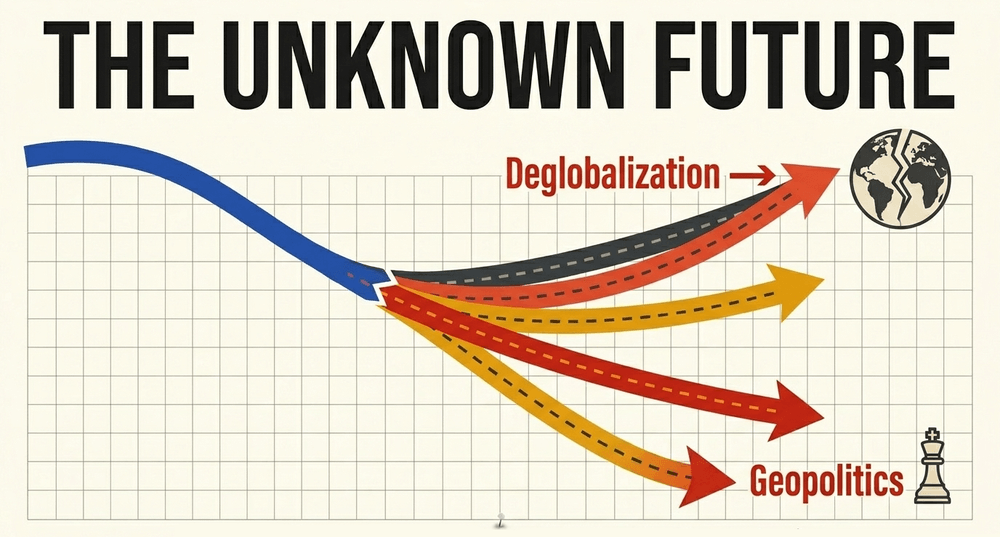
The apparent steepening of the curve in recent years carries a clear message for policymakers, investors, and businesses alike: the relatively forgiving environment of the 2010s - where labor markets could tighten dramatically without triggering inflation - may not be the baseline assumption going forward. In an era shaped by geopolitical disruption, deglobalization pressures, and volatile supply chains, understanding the current slope and position of the Phillips Curve is not just an academic exercise. It is a practical necessity for anyone navigating the modern economy.
Share now









Key takeaways
- The Phillips Curve illustrates an inverse relationship between inflation and unemployment, first documented by economist A.W. Phillips using UK wage and unemployment data spanning 1861 to 1957.
- Paul Samuelson and Robert Solow adapted Phillips' original wage-focused model to address broader consumer price inflation, transforming it into an active tool for fiscal and monetary policymakers.
- Milton Friedman (1968) and Edmund Phelps (1967) independently introduced the vertical Long-Run Phillips Curve, arguing that no permanent trade-off between inflation and unemployment exists once expectations fully adjust.
- NAIRU (Non-Accelerating Inflation Rate of Unemployment) is the unemployment level at which inflation remains stable and neither accelerates nor decelerates; US estimates shifted from 5-6% historically to below 4% following the 2008 financial crisis.
- The Phillips Curve flattened significantly from the early 1980s through 2007, largely due to better-anchored long-run inflation expectations following the Volcker disinflation and the dampening effects of globalization.
- Post-pandemic data shows a clear steepening of the curve across many industrialized nations; US CPI inflation peaked at 9.1% in June 2022 - a 40-year high - while unemployment remained near historic lows of 3.5-3.7%.
- The wage-price spiral - where rising prices drive wage demands that raise production costs, which are then passed on as further price increases - represents a critical second-round inflation mechanism tracked through the Phillips Curve framework.
- Anchored inflation expectations are among the most important variables in the expectations-augmented Phillips Curve; when public trust in a central bank's inflation target erodes, the curve can shift sharply and unpredictably.
- Cross-country evidence shows significant variation: Japan's prolonged deflationary experience and the Eurozone's structurally diverse labor markets both challenge simple universal applications of the model.
- Critics note the curve's structural instability, the unobservable nature of NAIRU, and its limited ability to capture supply-side inflation drivers - including global supply chains, fiscal stimulus, and corporate pricing power - as constraints on its reliability as a standalone policy rule.
- The Federal Reserve and European Central Bank continue to use expectations-augmented Phillips Curve models to calibrate interest rate decisions and assess whether inflation expectations remain sufficiently anchored to their targets.
- A steeper Phillips Curve - as current evidence suggests - implies central banks have materially less room for policy error than was widely assumed during the low-volatility decade of the 2010s.
Sources
- EconLib - Phillips Curve https://www.econlib.org/library/Enc/PhillipsCurve.html
- Brookings Institution - The Hutchins Center explains the Phillips curve https://www.brookings.edu/articles/the-hutchins-center-explains-the-phillips-curve/
- Federal Reserve Bank of Chicago - The recent steepening of Phillips curves https://www.chicagofed.org/publications/chicago-fed-letter/2023/475
- Federal Reserve Bank of St. Louis - What is the Phillips curve and why has it flattened? https://www.stlouisfed.org/open-vault/2020/january/what-is-phillips-curve-why-flattened
- Policonomics - Expectations-augmented Phillips curve https://policonomics.com/expectations-augmented-phillips-curve/
- Bureau of Labor Statistics - Consumer prices up 9.1 percent over the year ended June 2022 https://www.bls.gov/opub/ted/2022/consumer-prices-up-9-1-percent-over-the-year-ended-june-2022-largest-increase-in-40-years.htm
- Federal Reserve History - The Great Inflation and the Volcker Disinflation https://www.federalreservehistory.org/essays/great-inflation
- IMF Working Paper - Wage-Price Spirals: What Is the Historical Evidence? https://www.imf.org/en/Publications/WP/Issues/2022/07/29/Wage-Price-Spirals-What-is-the-Historical-Evidence-520653
- European Central Bank - The Phillips curve at the ECB https://www.ecb.europa.eu/pub/economic-bulletin/articles/2019/html/ecb.ebart201904_01~b15a9e863a.en.html
- Wikipedia - Phillips curve https://en.wikipedia.org/wiki/Phillips_curve
- Wikipedia - NAIRU https://en.wikipedia.org/wiki/NAIRU
- Published 2026-05-26 06:28
- Modified 2026-05-26 20:47
