

-
 Redaction
Fibonacci retracement levels for FX traders
Master Fibonacci retracement levels in FX trading. Learn key ratios, confluence models, stop-loss placement, and how institutional traders use the golden ratio.
Market volatility is rarely as chaotic as it appears to the untrained eye. For institutional traders and quantitative analysts, the ebb and flow of currency pairs follow structural patterns rooted in mathematical logic. Among the most durable tools in the technical arsenal is the Fibonacci retracement - and for good reason.
As global currency markets grow more algorithm-driven, these mathematical levels have become even more embedded in the decision-making of both automated systems and discretionary traders. Whether you are trading EUR/USD on a 4-hour chart or managing a multi-million dollar FX book, Fibonacci retracements offer a disciplined framework for identifying high-probability support and resistance zones.
"Fibonacci retracements provide a framework for identifying potential support and resistance levels by leveraging the proportions found in the Fibonacci sequence."
This guide covers the core mathematical principles, practical application methodology, confluence-based entry models, and critical risk management rules - written for traders who want to move beyond surface-level understanding and apply these levels with institutional-grade precision.
What is the Fibonacci sequence and why does it matter in FX?
The Fibonacci sequence - 0, 1, 1, 2, 3, 5, 8, 13, 21, 34, 55, 89, 144, and so on - is more than a mathematical curiosity. Each number is the sum of the two preceding ones, producing a chain of values that converges on a set of fixed proportional relationships as it progresses toward infinity.
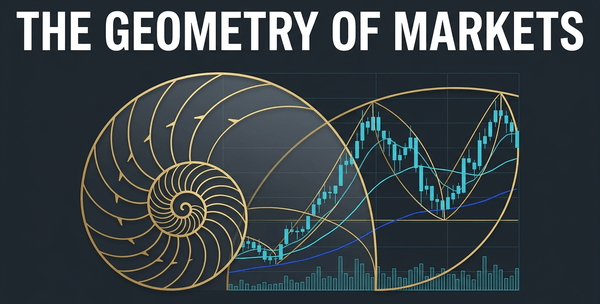
These proportions appear throughout the natural world: the spiral of a nautilus shell, the branching of trees, the arrangement of seeds in a sunflower. In financial markets, they manifest in collective human behaviour. Crowd psychology - the fear, greed, and herd instinct that drives buying and selling - tends to create price structures that mirror these natural ratios, particularly in the corrective phases that occur after an impulse move.
In foreign exchange (FX), this translates into specific percentage retracement levels where price corrections frequently pause, reverse, or accelerate. Understanding how those ratios are derived - not just memorising the numbers - separates a competent technical analyst from one who simply draws lines on a chart.

Mathematical principles and derivation
The utility of Fibonacci retracements stems not from the integers in the sequence itself, but from the consistent ratios that emerge as the sequence progresses. These ratios define the percentages plotted on price charts and are derived through precise mathematical relationships within the sequence.
The golden ratio and its derivatives
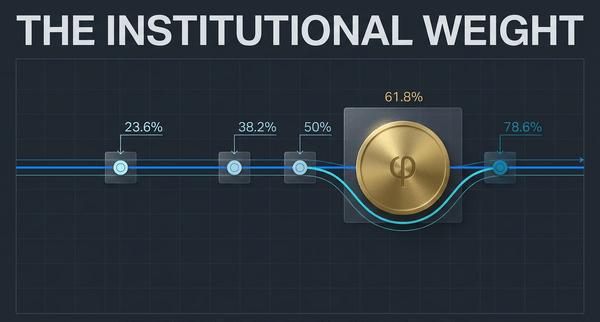
The most significant ratio is 61.8%, universally referred to as the Golden Ratio or Phi (φ). It is calculated by dividing any number in the sequence by the number immediately following it. For example, 55 ÷ 89 = 0.6179. As the sequence extends, this division converges ever closer to 0.618.
This level is widely regarded as the most critical retracement zone in technical analysis. When a currency pair pulls back to the 61.8% level and holds, it typically signals a high-probability continuation of the original trend - and institutional order books tend to reflect exactly that.
The other primary ratios used in FX technical analysis are:
- 38.2% - calculated by dividing a number in the sequence by the number two places to its right (e.g., 21 ÷ 55 = 0.381). This represents a shallow retracement, most commonly observed in strong, fast-trending markets where price barely pauses before continuing.
- 23.6% - found by dividing a number by the value three places to its right (e.g., 13 ÷ 55 = 0.236). This marks the first line of defence during a pullback and often signals initial market hesitation.
- 78.6% - the square root of 0.618. This is a deep retracement level, implying a significant test of the trend's origin. Some analysts also use 76.4%, the mathematical complement of 23.6% (i.e., 1 − 0.236).
- 50% - while not technically derived from the Fibonacci sequence, the 50% level is included in virtually every charting tool due to its psychological weight. It represents the exact midpoint of a major price swing - the equilibrium point where bulls and bears are most evenly matched.
Why 61.8% carries the most institutional weight
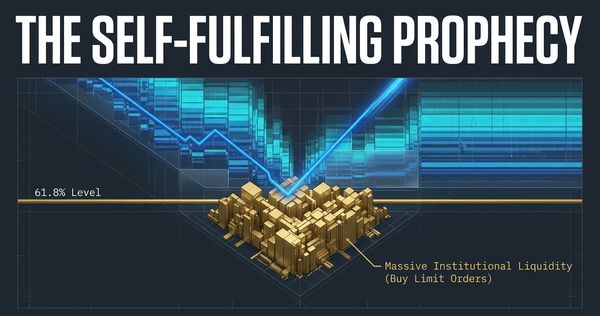
Of all these levels, the Golden Ratio commands the most attention from professional market participants. Large hedge funds, central bank trading desks, and algorithmic systems are explicitly programmed to monitor price behaviour at this zone. This concentration of attention creates concentrated liquidity - and concentrated liquidity creates predictable price reactions.
When you see a sharp bounce or rejection at 61.8%, you are observing crowd behaviour at its most coordinated. This is not coincidence. It is the direct result of decades of institutional convention converging on a single mathematical anchor point.
How to apply Fibonacci retracements in FX technical analysis
Price action in the FX market moves in waves, not straight lines. Every sustained trend consists of an impulse move - the primary directional move - followed by a corrective move, where price partially retraces before the trend resumes. Fibonacci retracements are designed specifically to measure the depth of that correction.
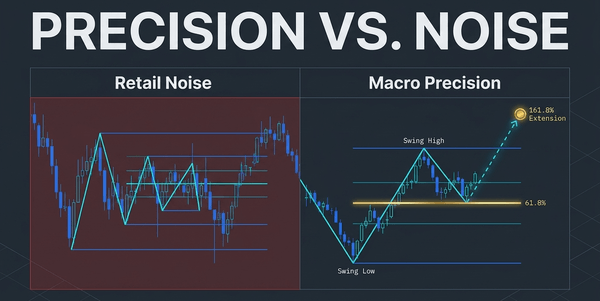
To apply the tool correctly, you must identify two anchor points: the swing high and the swing low.
Mapping an uptrend
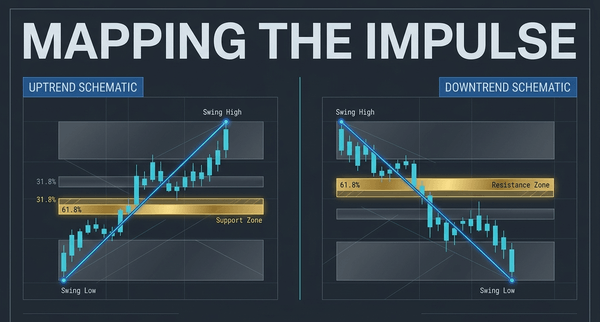
In an uptrend, draw the Fibonacci tool from the swing low to the swing high. The horizontal lines plotted below the current price mark potential support levels - zones where buyers may step back in and resume the upward move.
A practical example: if GBP/USD rallies from 1.2500 (swing low) to 1.2900 (swing high), the 38.2% retracement falls at approximately 1.2747. If price pulls back and holds there, it suggests the trend remains intact and the original buyers are still in control. A break below 1.2747 brings the 50% level at 1.2700 and the 61.8% level at 1.2653 into focus.
Mapping a downtrend
In a downtrend, draw the tool from the swing high to the swing low. The resulting lines above current price represent potential resistance - zones where short-sellers may re-enter the market, expecting the temporary rally to fail.
A failure to break above the 61.8% resistance level in a downtrend is often the clearest confirmation that bearish momentum remains dominant. Many professional traders treat this as a textbook short entry setup, particularly when supported by other technical factors.
Calculation mechanics
Modern charting platforms automate these calculations, but understanding the arithmetic allows you to verify a setup independently and catch software errors. For a price move from Low (L) to High (H):
- 38.2% retracement: H − (H − L) × 0.382
- 50% retracement: H − (H − L) × 0.500
- 61.8% retracement: H − (H − L) × 0.618
- 78.6% retracement: H − (H − L) × 0.786
These price points define alert zones - not guaranteed reversal points, but areas where order flow is statistically likely to concentrate and where price is most likely to react in a measurable way.
Which timeframes work best for Fibonacci retracement?
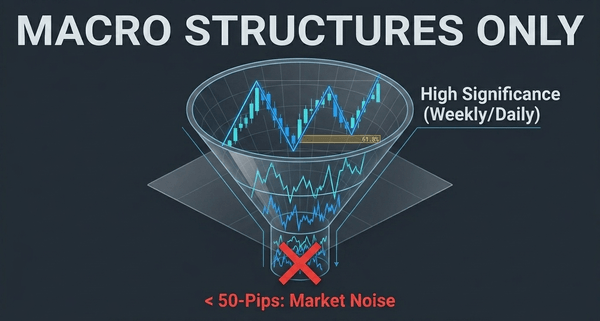
Fibonacci levels are timeframe-agnostic in principle - they can be applied to a 15-minute scalping chart or a monthly macro chart. However, the significance of the level scales directly with the timeframe.
- Higher timeframes (daily, weekly, monthly) produce the most reliable levels because they capture the true structural swing points that institutional traders monitor. A 61.8% retracement on a weekly EUR/USD chart carries far more weight than the same level on a 5-minute chart.
- Intermediate timeframes (4-hour, daily) are the sweet spot for most swing traders and position traders. They balance signal quality with practical trade frequency.
- Lower timeframes (15-minute, 1-hour) can be used for entry precision once a higher-timeframe Fibonacci zone has been identified. The standard approach is to use the higher timeframe to identify the zone, lower timeframe to time the entry.
A useful rule of thumb: never draw Fibonacci retracements on less than 50-100 pips of swing range in the FX market. Below that threshold, the calculated levels become too sensitive to minor price noise and lose statistical relevance.
Strategic implementation: building a confluence model
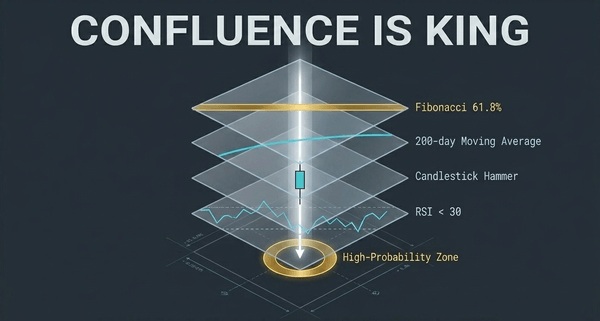
Fibonacci retracements are not intended to be used in isolation. Relying solely on a 61.8% line to execute a trade is a recipe for capital depletion. Institutional-grade trading demands a confluence of technical factors - a layered model where multiple indicators agree before a trade is taken.
"These levels function as a framework to understand market behaviour, identifying probable reaction zones that must be confirmed by other data points."
Technical tools that strengthen Fibonacci setups
- Moving averages - when a Fibonacci level aligns with a major moving average (such as the 200-day SMA or the 50-day EMA), the resulting support or resistance cluster becomes significantly more powerful. Algorithms from multiple systematic strategies will be pointing at the same price.
- Trend lines - a retracement that reaches a key diagonal trend line at the same price as a Fibonacci level creates a double-confirmation of structural support or resistance.
- Candlestick patterns - rather than entering blindly at a Fibonacci zone, wait for a specific price action signal: a hammer, bullish engulfing, or morning star in an uptrend; a shooting star or bearish engulfing in a downtrend. These candle formations confirm that the market is actively rejecting the level.
- RSI and oscillators - an RSI reading below 30 (oversold) occurring at a 61.8% retracement in an uptrend is one of the highest-conviction entry signals available in discretionary FX trading. The oscillator and the structural level are telling the same story simultaneously.
- Volume and order flow - where volume data is available (as in FX futures or certain ECN platforms), a spike in buying volume at a Fibonacci support zone dramatically increases confidence in the setup.
The more of these factors that align at a single price level, the higher the probability of a meaningful reaction.
Pre-trade checklist for Fibonacci setups
Before committing capital at any Fibonacci level, professional traders verify each of the following:
- Is the retracement drawn between major structural swing points on the higher timeframe?
- Does the Fibonacci zone align with at least one additional technical factor (moving average, trend line, oscillator)?
- Is the trade direction aligned with the primary trend?
- Is a confirming candlestick pattern forming at or near the zone?
- Is there a high-impact news event scheduled within the trade's holding window?
- Are stop-loss and profit target levels clearly defined before entry?
If any of these boxes cannot be checked, the setup does not meet the minimum threshold for execution. Discipline at this stage is what separates consistent performers from discretionary guesswork.
The psychology behind Fibonacci's self-fulfilling effect
The effectiveness of Fibonacci retracements is frequently debated in the context of the efficient market hypothesis. Critics argue there is no inherent mathematical reason for a currency to reverse at 38.2% of its previous swing. This is a fair challenge - and the answer lies in market psychology, not physics.
When tens of thousands of traders - from retail participants to quantitative hedge funds - are monitoring the same 61.8% level on EUR/USD, they cluster their buy orders in that vicinity. That concentration of liquidity creates the support that the tool predicted. The tool works, at least in part, because enough people believe it works.
In this sense, Fibonacci levels are a map of collective trader psychology. They represent the price points where market conviction is most intensely tested and where the battle between buyers and sellers is most likely to reach a visible resolution. This self-reinforcing dynamic has only intensified as Fibonacci levels have been incorporated into mainstream algorithmic trading systems.
Fibonacci retracements and algorithmic trading systems
The integration of Fibonacci levels into systematic trading has fundamentally changed how these zones behave. Where once a 61.8% retracement was primarily a discretionary trader's reference point, it is now hard-coded into countless algorithmic execution engines across the interbank market.
High-frequency trading (HFT) firms, multi-strategy hedge funds, and even retail algorithmic platforms use Fibonacci ratios as quantitative inputs for entry filters, stop-loss placement, and take-profit logic. The precision of the levels - being exact mathematical calculations rather than subjective zones - makes them uniquely well-suited to automation.
The practical implication for discretionary traders is significant: the self-fulfilling dynamic described above is no longer driven solely by human psychology. It is now partially enforced by machines executing at speed. When price approaches a major 61.8% level on a daily EUR/USD chart, the clustering of algorithmic orders is orders of magnitude larger than it was two decades ago. This does not make the level infallible - but it does mean the initial reaction at that zone is typically faster, sharper, and more decisive than in pre-algorithmic eras.
Fibonacci retracements and Elliott Wave theory
For traders familiar with Elliott Wave analysis, Fibonacci retracements are not a standalone tool - they are the mathematical backbone of the entire framework. Ralph Nelson Elliott's theory of market cycles is built on the premise that price moves in structured wave sequences, and the corrective waves within those sequences adhere closely to Fibonacci ratios.
Specifically, Wave 2 corrections in an Elliott sequence most commonly retrace 50% to 61.8% of Wave 1. Wave 4 corrections typically respect the 23.6% to 38.2% zone. This internal consistency means that traders using both frameworks simultaneously have a powerful cross-referencing tool: when an Elliott Wave count and a Fibonacci retracement level point to the same price zone, the structural argument for a reaction becomes exceptionally strong.
"When Elliott Wave analysis and Fibonacci retracements converge at the same price level, the probability of a meaningful market reaction increases substantially - this is the kind of confluence that institutional analysts spend considerable time searching for."
You do not need to be a dedicated Elliott Wave practitioner to benefit from this relationship. Even a basic understanding of impulse and corrective wave structure can help you identify which Fibonacci level is most likely to hold in a given setup.

Common mistakes FX traders make with Fibonacci retracements
Even experienced traders misapply these tools. The most frequent errors include:
- Selecting the wrong swing points - anchoring to an intraday wick instead of a meaningful structural high or low will produce levels that carry no institutional significance. Always use major swing points that are visible on the higher timeframe chart.
- Trading Fibonacci levels in isolation - entering a trade simply because price touched 61.8%, without any confirmation signal, ignores the fact that price can and does break through every Fibonacci level in strongly trending or high-volatility markets.
- Ignoring the broader trend - Fibonacci retracements work best when traded in the direction of the primary trend. Fading a trend at a retracement level against strong fundamental momentum (e.g., a central bank rate divergence) is a low-probability approach.
- Using too many levels simultaneously - cluttering a chart with every possible Fibonacci ratio (23.6%, 38.2%, 50%, 61.8%, 76.4%, 78.6%) creates ambiguity. Most professional traders focus primarily on 38.2%, 50%, and 61.8% and treat 78.6% as a last line of defence.
- Not adjusting for high-impact news events - during major central bank announcements, NFP releases, or geopolitical shocks, price action can skip through multiple Fibonacci levels in minutes. Risk parameters must be adjusted accordingly before these events.
Advanced applications: extensions and expansions
While retracements measure corrections within a trend, Fibonacci extensions project where price may travel after the trend resumes. These are essential for setting rational profit targets, particularly in markets trading at new highs or lows where there are no obvious prior resistance levels.
The most widely used extension levels are:
- 127.2% - a common first profit target after a trend resumes from a retracement
- 161.8% - the most popular extension level, derived directly from the Golden Ratio; frequently used as a primary target in breakout trades
- 261.8% - used in strongly trending markets or in wave analysis frameworks such as Elliott Wave theory
Fibonacci expansions (sometimes called "price projections") use three points rather than two - measuring the corrective wave and projecting the next impulse leg from the end of the correction. This is a more sophisticated technique used primarily by position traders and swing traders managing multi-week or multi-month setups.
In high-volatility environments - such as during central bank interest rate decisions or major geopolitical shifts - price may bypass shallow retracements entirely and plunge directly to the 78.6% level before reversing. Adaptability is non-negotiable. The ratios are constant; the market's adherence to them is fluid.
Risk management within the Fibonacci framework
Risk management is the single most important component of any Fibonacci-based strategy. These levels define zones of probability, not zones of certainty. A trade without a pre-defined stop-loss at a Fibonacci level is simply a speculation with undefined risk.
The standard professional approach:
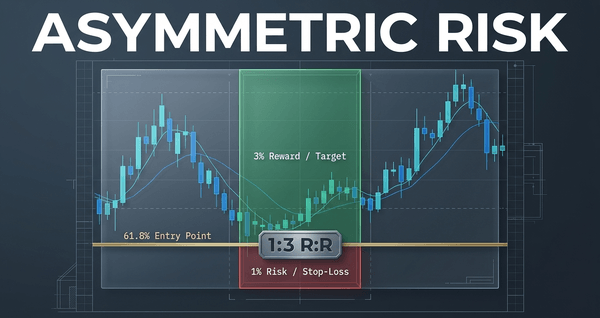
- Stop-loss placement - if entering long at the 50% retracement, place the stop just below the 61.8% level. If price breaks the 61.8% mark, the original bullish thesis is invalidated and capital preservation takes priority over hope.
- Position sizing - because you know the exact price at which you are wrong (the next Fibonacci level), you can calculate position size mathematically to risk a defined percentage of account equity on every trade - typically 1-2% for professional FX accounts.
- Risk-to-reward ratio - a trade entered at the 61.8% retracement targeting the prior high offers a clear, measurable risk-to-reward profile. If the stop is 30 pips below 61.8% and the target is 90 pips above entry, the trade carries a 1:3 reward-to-risk ratio - the kind of asymmetry that allows a strategy to remain profitable even with a sub-50% win rate.
"By treating Fibonacci levels as a component of a comprehensive trading plan, market participants can strip away the noise of intraday fluctuations."
Frequently asked questions
Are Fibonacci retracements reliable in FX trading? They are statistically reliable in context - meaning when combined with trend direction, timeframe analysis, and confirmation signals. Used in isolation, no single technical tool offers an edge.
What is the most important Fibonacci level? The 61.8% level (the Golden Ratio) is universally regarded as the most significant, followed by 38.2% and 50%. The 78.6% level is critical in deep-retracement scenarios.
Do Fibonacci levels work on all currency pairs? Yes, though they tend to be most reliable on major and minor pairs with high liquidity (EUR/USD, GBP/USD, USD/JPY, AUD/USD), where institutional participation is highest and the self-fulfilling dynamic is strongest.
How do I know which swing high and swing low to use? Use the most recent significant swing that defines the current trend structure. On a daily chart, this typically means a swing that spans at least several days and is clearly visible without zooming in. Avoid selecting minor wicks on lower timeframes.
Can Fibonacci retracements be automated? Yes. Many algorithmic trading systems incorporate Fibonacci levels as key inputs for entry, stop-loss, and target logic. The levels are objective and mathematically precise - making them well-suited to systematic strategies.
How do Fibonacci retracements differ from Fibonacci extensions? Retracements measure how far price pulls back within an existing trend, identifying potential support or resistance during the correction. Extensions project how far price may travel once the trend resumes, and are used primarily for profit target placement rather than entry timing.
The bottom line
Fibonacci retracements endure in FX technical analysis because they capture something real: the proportional rhythms of collective human decision-making under conditions of uncertainty. Whether used by a discretionary swing trader in Warsaw or embedded in a high-frequency algorithm in London, the underlying logic remains the same.
These ratios provide a disciplined, objective lens through which to view price action - one that helps traders stay aligned with the underlying mechanics of market flow rather than reacting emotionally to short-term noise. Master the mathematics, build the confluence model, respect the pre-trade checklist, manage the risk, and Fibonacci retracements become one of the most reliable navigation tools available to the modern FX trader.
Share now









Key takeaways
- Fibonacci retracements are derived from a mathematical sequence in which each number is the sum of the two preceding ones, producing consistent ratios as the sequence extends toward infinity.
- The three primary retracement levels used in FX technical analysis are 23.6%, 38.2%, and 61.8%; the 50% level is universally included despite not being a true Fibonacci ratio, due to its psychological significance as the midpoint of a major price swing.
- The 61.8% level - known as the Golden Ratio or Phi (φ) - is approximated by dividing any number in the sequence by the number immediately following it (e.g., 55 ÷ 89 ≈ 0.618) and is regarded as the single most important retracement zone in institutional FX trading.
- The 78.6% level is the square root of 0.618 and represents a deep retracement; a move to this level signals a significant structural test of the original trend's origin.
- In an uptrend, retracement levels are calculated by subtracting the ratio multiplied by the full price range from the swing high: H − (H − L) × ratio.
- Fibonacci levels are plotted between a confirmed swing high and swing low; in uptrends they identify potential support zones, in downtrends they identify potential resistance zones.
- Traders treat these levels as alert zones - areas of statistically elevated probability - rather than absolute reversal guarantees.
- The reliability of Fibonacci setups increases substantially when levels align with other technical factors such as moving averages, diagonal trend lines, key candlestick patterns, or oscillator readings (e.g., RSI below 30 at the 61.8% level in an uptrend).
- Fibonacci extensions - most commonly at 127.2%, 161.8%, and 261.8% - are used to project profit targets once a trend resumes, particularly in markets trading at new highs or lows where prior reference levels do not exist.
- Higher timeframes (daily, weekly) produce the most institutionally significant Fibonacci levels; the standard professional approach is to identify the zone on a higher timeframe and time the entry on a lower timeframe.
- The most common trader errors include selecting incorrect swing points, trading levels without confirmation signals, and failing to adjust risk parameters around high-impact macroeconomic events such as central bank announcements or NFP releases.
- Fibonacci retracements are embedded in many algorithmic and high-frequency trading systems, reinforcing their self-fulfilling dynamic and increasing the speed and decisiveness of price reactions at key levels across major and minor FX pairs.
- In Elliott Wave theory, Wave 2 corrections most commonly retrace 50% to 61.8% of Wave 1, while Wave 4 corrections typically respect the 23.6% to 38.2% zone - making Fibonacci ratios the mathematical backbone of the entire wave framework.
- Professional FX traders typically limit risk to 1-2% of account equity per trade and target a minimum 1:3 reward-to-risk ratio when entering at key Fibonacci levels.
Sources
- Dukascopy https://www.dukascopy.com/swiss/english/marketwatch/articles/fibonacci-trading-strategy/
- Fusion Markets https://fusionmarkets.com/posts/fibonacci-cheat-sheet-trading-ratios
- TrendSpider https://trendspider.com/learning-center/introduction-to-fibonacci-trading/
- StockCharts https://chartschool.stockcharts.com/table-of-contents/chart-analysis/chart-annotation-tools/fibonacci-retracements
- Zerodha Varsity https://zerodha.com/varsity/chapter/fibonacci-retracements/
- Published 2026-06-02 14:07
- Modified 2026-06-02 14:07

-
Redaction