





-
 Redaction
Institutional liquidity traps: hidden block trades
Learn how institutional liquidity traps work and how hidden block trades move through dark pools, iceberg orders, and off-exchange execution venues today.
Market efficiency is a story we tell ourselves. Retail traders stare at RSI readings and sentiment gauges while the real architecture of price gets built somewhere else entirely - in rooms where fund managers move capital blocks so large they'd vaporize their own entry price if they dared hit the public bid. That's the institutional liquidity trap. Not the textbook version where zero rates fail to move the needle on growth. This one's mechanical. It happens the instant a fund's required volume outstrips what the order book can actually absorb at a given price.
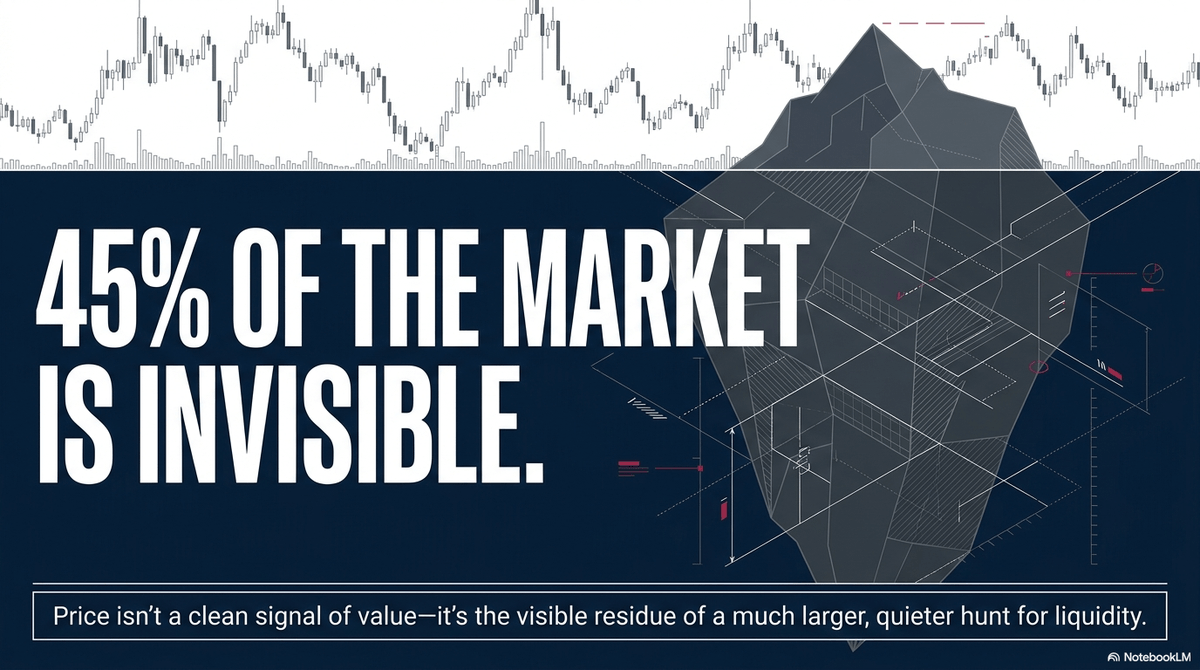
Get trapped like that and you've got two bad options: signal your hand to every HFT algo hunting for exactly this kind of desperation, or find another way in. Wall Street chose door number two decades ago, and it built an entire shadow ecosystem to do it - off-exchange venues, execution algorithms, camouflage techniques that would make a submarine captain proud. I've watched this game from both sides of the glass. Price isn't a clean signal of value. It's the visible residue of a much larger, much quieter hunt for liquidity.
Recent FINRA ATS transparency data puts pure dark pool volume at roughly 15 to 18 percent of total U.S. equity volume, but that number only tells half the story. Fold in wholesaler internalization and other off-exchange mechanisms, and total off-exchange trading now sits at 40 to 45 percent of the entire U.S. equity tape - with some quarterly readings in 2026 pushing that combined figure closer to 59 percent once you count every wholesaler fill. Either way you slice it, the hidden game isn't a sideshow anymore. It's close to half the market, and depending on how you count, it might already be the majority.
Defining the hidden block trade
Officially, a block trade means at least 10,000 shares or a transaction worth $200,000, whichever is less. That's NYSE Rule 127.10 - codified, unambiguous, and the closest thing to a legal definition this corner of the market has, since neither Congress nor the SEC has ever bothered to write one into statute. But down in the trenches of modern electronic markets, anything north of $50,000 or 5,000 shares can already start tripping institutional detection systems. The formal threshold and the practical one simply aren't the same animal - and at 2026 large-cap prices, the share-count leg of that old rule is by far the stricter test. A $200,000 order in a stock trading at $500 a share barely clears 400 shares. The dollar threshold hasn't kept pace with the market it was written for.
These trades hide because they route through Alternative Trading Systems (ATS) and dark pools instead of lit exchanges. No visible bid. No visible ask. Nothing for the tape to show until after the trade's already done - and even then, FINRA rules require the trade to be reported to the Trade Reporting Facility within 10 seconds, though aggregate ATS volume data itself is published on a two-week delay, which is more than enough of a gap to blunt front-running.

Ask any trading desk why they bother with this plumbing and you'll hear the same four answers:
- Market impact reduction. Drop a million-share order on a public book and watch the spread blow out as market makers scatter for cover.
- Anonymity. Nobody wants a competitor reading their accumulation pattern in real time.
- Price stability. Private negotiation at the NBBO midpoint often beats whatever the lit market would have offered.
- Liquidity sourcing. In a thin, illiquid name, you're not finding a counterparty on the public board. You're calling someone directly.
That last point matters more than people give it credit for. In a stock trading a few hundred thousand shares a day, there simply isn't a public buyer sitting there for your 200,000-share block. The order has to go find a home privately, or it doesn't get filled at all.
The mechanics of institutional stealth
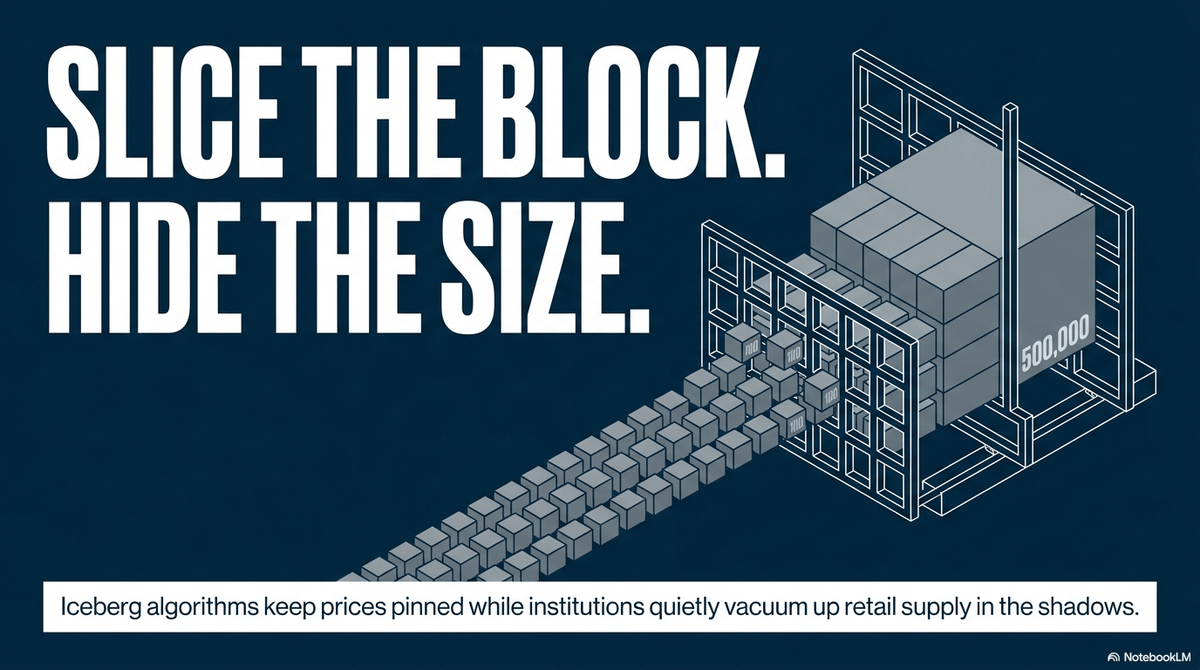
Want to see how the sausage actually gets made? Start with the iceberg order. An algorithm takes a 500,000-share parent order and slices it into small child orders - a hundred shares here, a hundred there. The Level 2 book shows you the tip while the rest sits invisible, waiting its turn. Every time a slice fills, the algo instantly replaces it. Price stays pinned in a tight zone while the institution quietly vacuums up every retail seller willing to part with shares at that level.
Then there are the dark pools themselves - private venues run by the big banks and market makers, with UBS ATS, Virtu Financial's venues, and Goldman Sachs's Sigma X2 consistently ranking among the highest-volume operators. FINRA counts roughly 30 to 50 active ATS venues operating in the U.S. at any given time, and the concentration at the top is stark: the ten largest pools handle something like 70 percent of all reported ATS volume between them. The information asymmetry here isn't an accident, it's the entire point. Michael Kyle's 1985 model of continuous auctions and insider trading laid out the mechanics decades ago: the informed party knows what it's doing, the rest of the market sees a vacuum, and price discovery happens on the informed side's terms. These pools match buyers and sellers internally, completely bypassing NYSE and Nasdaq. The only trace left behind is a high-volume print that hits the tape well after the actual price movement has already happened.
Over-the-counter and exchange block facilities
For the transactions that dwarf even what a dark pool can comfortably absorb - positions representing 5 percent, 10 percent of a company's entire float - you need a different mechanism entirely. That's where the blockhouse comes in. A specialized brokerage works the phones, calling other institutional accounts one by one until it finds a single counterparty willing to take the entire block. This is about as close to pure peer-to-peer finance as modern markets get. Futures and options markets run their own version through dedicated exchange block facilities like CME's Rule 526, registering privately negotiated cross trades without moving the public tape until the deal is locked and formally reported.
When that print finally hits, it creates what traders call a liquidity shock. A block executed above the current market signals institutional conviction on the buy side. A large print at the bid tells you a fund is offloading size, and that usually kicks off a fast repricing as the rest of the market catches up. The direction matters here too. Buyer-initiated blocks tend to carry more persistent price impact than seller-initiated ones - a pattern documented across decades of market microstructure research, including the landmark work of Chan and Lakonishok, whose 1993 and 1995 studies of institutional trading behavior on the NYSE and AMEX found that purchases leave a longer-lasting fingerprint on price than sales. The logic tracks: accumulation usually reflects fresh, firm-specific conviction, while a sale is just as often a liquidity or portfolio-rebalancing decision with nothing to do with the company's outlook.
Detecting the institutional footprint: order blocks
Here's the thing about size - you can hide the trade, but you can't hide the aftermath. Every real move in the market leaves a trace, and traders call that trace an "order block." It's not a lagging indicator pulled off a chart package. It's the last opposing candle before an impulsive move that actually breaks market structure. A bullish order block is simply the last bearish candle before price rips higher and takes out a previous high.
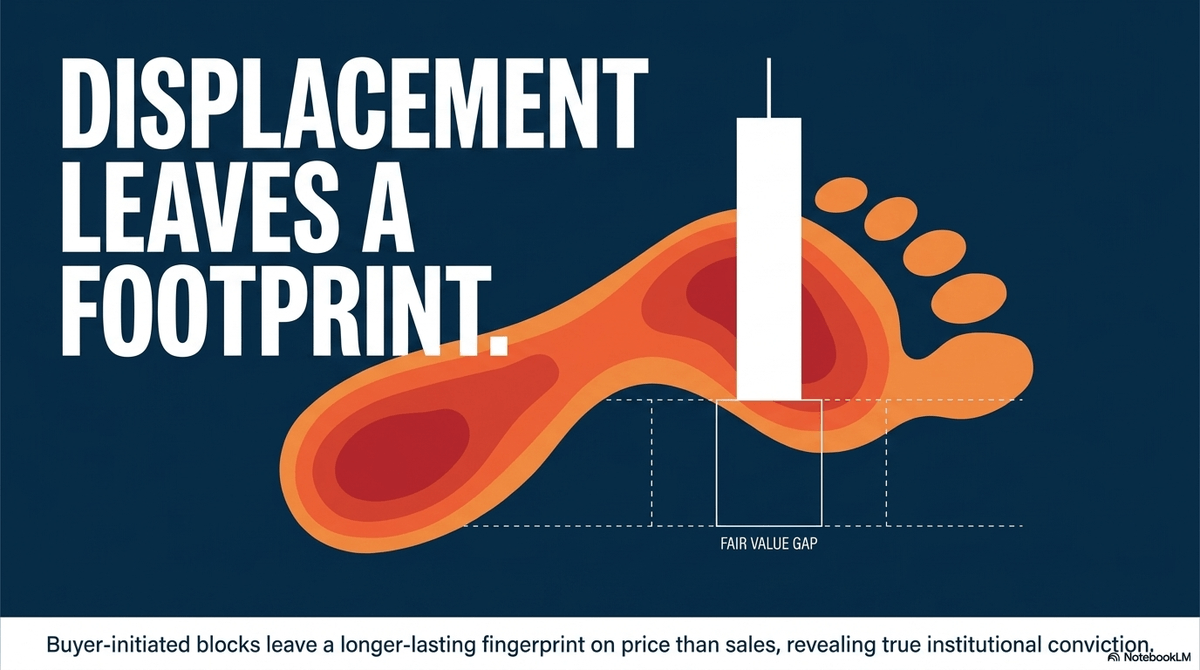
Why does it work this way? Because institutions buying size often need to manufacture sell-side liquidity first. They push price down just enough to trigger retail stop-losses, and that forced selling becomes the exact supply they need to fill their own buy orders without moving the market against themselves. That last bearish candle is the final act of the setup. Once the institutional order is filled, price releases and catapults higher, often leaving behind what's called a fair value gap - a pocket of unfilled trading where the market simply skipped over price on its way up.
"Displacement is the single clearest tell of institutional participation. If price doesn't move away from the zone with real conviction, you're probably looking at noise, not size."
Identifying valid footprints
Not every candle formation deserves the "order block" label, and treating every wick like institutional activity is how retail traders talk themselves into bad trades. A handful of criteria separate signal from noise:
- Displacement. The move away from the block has to be sharp and clean. A slow drift is retail sentiment, not smart money.
- Volume confirmation. No meaningful volume spike on the breakout candle, no institutional weight behind the move. This one's non-negotiable.
- Break of structure (BOS). The move needs to actually breach a prior swing high or low. Anything short of that is just range-bound noise.
- Hidden order blocks. Zoom into lower timeframes and what looked like an unremarkable wick on the daily chart often reveals itself as a fully formed block on the 15-minute. This concept gets a lot of attention in Inner Circle Trader (ICT) methodology, and while I'm generally allergic to trading jargon dressed up as edge, the underlying mechanic - wick overlaps concealing true institutional entry - is real market structure, not mysticism.
Reading dark pool prints without the two-week lag
Institutional footprint hunting used to mean waiting on FINRA's official ATS reports, which still publish on a two-week delay - fine for research, useless for anyone trying to trade the signal while it's live. That gap is exactly why a cottage industry of dark pool trackers has sprung up, pulling individual TRF prints off the consolidated tape in near real time rather than waiting for the aggregated weekly numbers.
A few patterns are worth knowing even if you never touch one of these tools yourself:
- Elevated dark pool percentage. When off-exchange volume in a single name runs meaningfully above its own baseline for several consecutive sessions, rather than spiking for a single day, that's generally treated as more reliable than a one-day anomaly, which is just as often noise as signal.
- Print size relative to average. A sudden jump in the average size of individual dark pool prints - even without a corresponding jump in total volume - can mean a larger player is stepping in, distinct from the same size of institution simply trading more often.
- Print price relative to VWAP. Where the block executes matters. A cluster of prints at or above the volume-weighted average price reads differently than a cluster below it, and traders use that distinction to separate accumulation from distribution.
None of this is a crystal ball, and I'd treat any vendor's backtested win rate with the same skepticism I'd apply to a stranger's stock tip. But the underlying logic - that hidden size eventually leaves fingerprints on price, volume, and execution level - holds up under real market microstructure research, not just marketing copy.
Liquidity zones and stop-loss hunting
Institutions don't think in price. They think in liquidity pools. A swing high isn't resistance to a fund manager building a short - it's a stack of buy-side stops sitting there, ready to be triggered into exactly the kind of forced buying that lets the institution offload a massive short position without eating the full cost of impact themselves. So they push price through the level, trip the stops, and use that surge of forced buying to get their size filled.
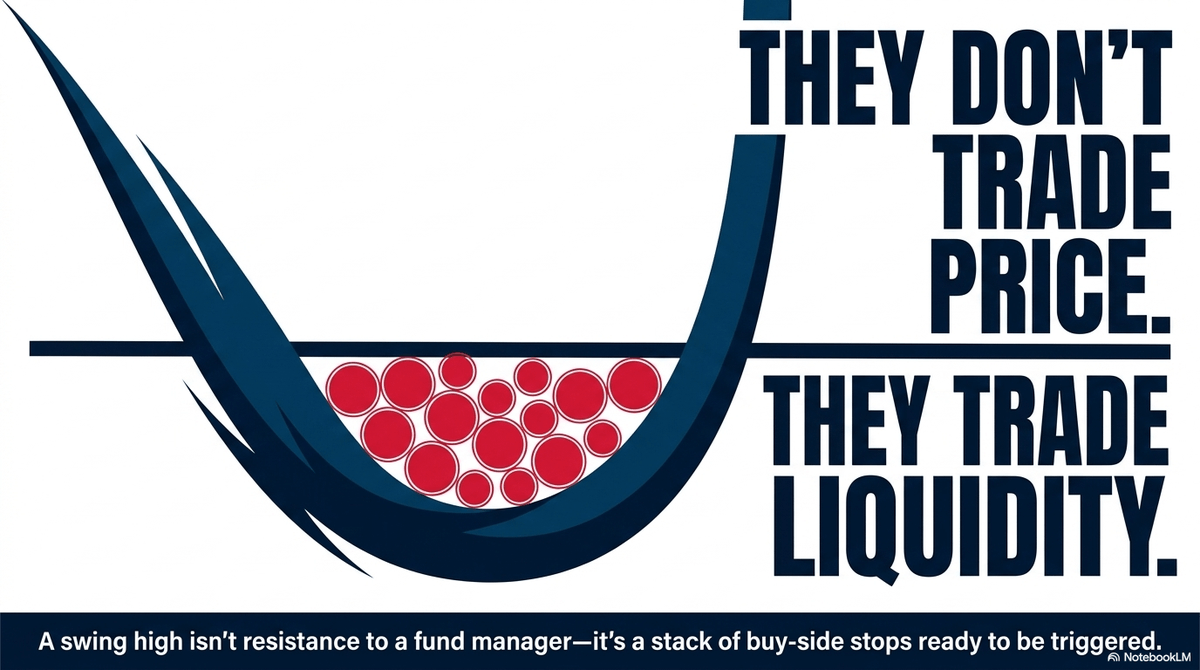
Traders call this a stop hunt or liquidity grab, and the signature is consistent: a sharp spike through a known level, an immediate rejection, then a reversal in the opposite direction. Learning to spot these zones before they get swept is one of the more useful skills a discretionary trader can build. The usual suspects:
- The prior day's high and low.
- Psychological round numbers - $100, $150, and so on.
- Equal highs or equal lows, which retail traders usually call double tops or double bottoms.
- Major Fibonacci retracement levels.
Footprint charts make this visible in real time - they break down the actual volume transacting at each price level, bid versus ask. See 5,000 lots trade on the bid at a support level and watch price refuse to crack lower? That's absorption. Somebody's sitting there catching every sell order like it's batting practice, and it's rarely a retail account doing the catching.
Position sizing plays directly into how well you can survive being on the wrong side of one of these grabs, which is worth reading up on separately - our piece on position sizing and drawdown math covers the risk-of-ruin mechanics that matter just as much as any entry signal.

The role of algorithmic trading and AI
The institutional footprint today is almost entirely digital. Algorithms now drive the overwhelming majority of volume on major exchanges, and these systems run with built-in risk controls monitoring market impact tick by tick. If an algo senses its own buying is pushing price too far too fast, it pauses. Waits for retail to push price back down. Resumes. That's exactly where the "stair-step" pattern in strong trends comes from - it's not organic, it's throttled.
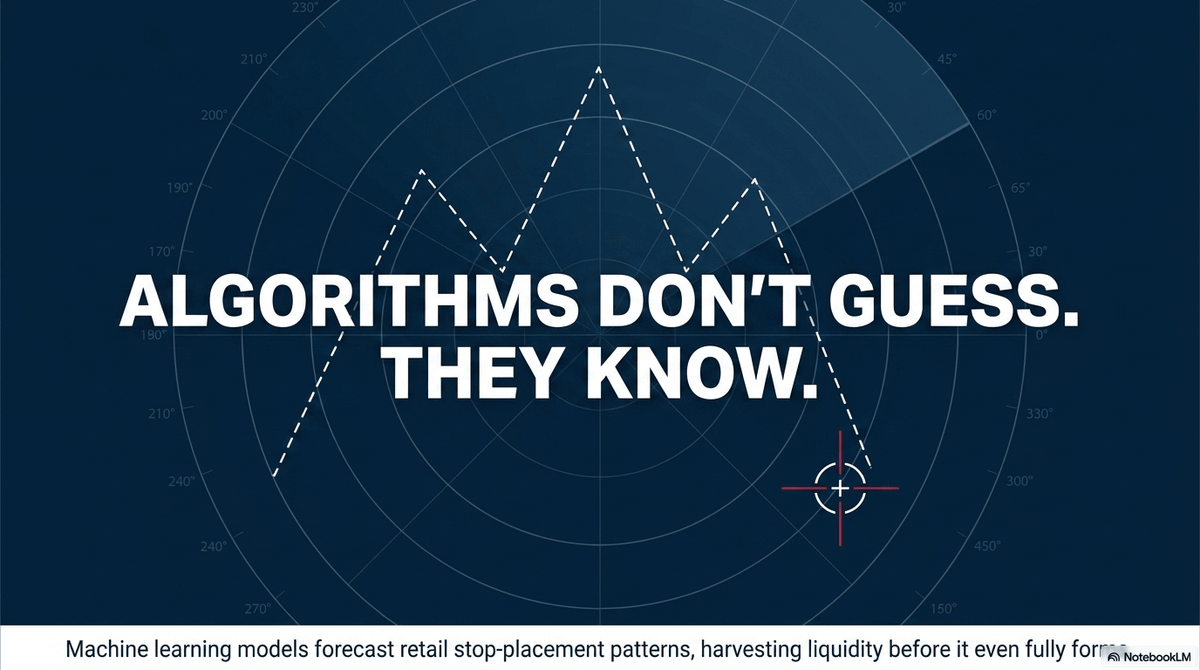
AI is pushing this further still. Machine learning models trained on historical stop-placement patterns can now forecast where retail liquidity is likely to cluster before it even forms. That predictive capability lets institutional systems orchestrate price action to harvest that liquidity with real precision - which is a big part of why classic chart patterns like head-and-shoulders have gotten less reliable in recent years. The algorithms aren't guessing where the pattern traders are looking. They know, and they're positioned to use it against them.
If you're trying to build a systematic edge around this kind of behavior, understanding your own emotional responses to being on the wrong side of a liquidity grab matters just as much as the technical setup - see our breakdown of how FOMO and emotional bias erode returns for the behavioral side of this equation.
The regulatory fight over where the dark stays dark
None of this plumbing exists in a vacuum, and it's worth knowing the fight currently playing out over it, because the outcome will decide how much of the market stays hidden. Back in December 2022 the SEC under then-Chair Gary Gensler proposed four rules aimed squarely at this ecosystem - a best execution standard, an order competition rule that would force many retail orders into open auctions before a wholesaler could internalize them, an order execution disclosure rule, and a rule targeting sub-penny pricing.
Only one of those four has actually crossed the finish line so far: the execution-quality disclosure rule, finalized in March 2024, which starts requiring broker-dealers to publish far more granular data on how well they're actually filling client orders. The order competition rule - the one that would have done the most to push volume out of the dark and onto lit exchanges - remains unfinished business, and the SEC has separately pushed back its own compliance deadline on the related Reg NMS tick-size and access-fee changes to November 2026.
Enforcement, in the meantime, hasn't waited around. The SEC brought roughly 14 enforcement actions tied to off-exchange trading venues in fiscal year 2025 alone, nearly double the annual average from 2018 through 2023, with recent actions increasingly focused on whether brokers are routing client orders to affiliated dark pools that provide genuinely inferior execution. That's on top of the headline settlements from the last decade - Barclays paid $70 million, Credit Suisse $84.3 million, and ITG $20.3 million to resolve dark pool misconduct cases - which is the historical backdrop that makes today's scrutiny feel less like a witch hunt and more like the regulator finally catching up to how the market actually trades.
None of this is a reason to expect the shadow ecosystem to disappear. Institutions have compelling, largely legitimate reasons to trade off-exchange, and regulators have said as much repeatedly. But the rules governing how transparent that activity has to be are actively in motion, and any trader building a strategy around dark pool footprints should expect the plumbing to look at least somewhat different a year or two from now.
Academic perspectives and market implications
Market microstructure research gives all of this a scientific backbone, and it's worth taking seriously rather than treating as trading-forum folklore. A stock can look perfectly liquid on the surface - tight bid-ask spread, steady quote flow - and still be hiding a cavernous lack of real depth underneath. When market makers pull back suddenly during a liquidity shock, that depth disappears exactly when it's needed most. Call it the secondary institutional liquidity trap: the exit door vanishes right as everyone's trying to use it.
Copeland and Galai's 1983 work on information effects and the bid-ask spread framed this well: market makers are effectively handing out a free option to anyone with better information than they have. To protect themselves from getting picked off by institutions trading on superior information, market makers widen spreads during volatile stretches. That protects the market maker. It does nothing for the retail trader footing a wider bill on every fill. Hedge funds, being considerably more nimble than large mutual fund complexes, tend to be the ones capitalizing on these dislocations - providing liquidity when it's expensive to do so and pulling back the moment risk starts climbing.

Final considerations for detecting institutional activity
Reading institutional footprints is an exercise in reading between the lines of the public tape, full stop. It requires ditching the question "what is the price?" in favor of the one that actually matters: "where is the liquidity?" Every impulsive move, every sharp rejection, every tight consolidation that suddenly explodes - these are all chapters in the same story, and that story is institutional order flow working itself out in real time.
To keep from getting trapped yourself, watch for displacement following a liquidity sweep. When the market breaks structure and leaves a fair value gap behind, the institution has already shown you its hand - you just have to be paying attention. The footprint left behind remains one of the only genuinely reliable signals in a market that's fundamentally built to obscure intent. Managing exits around these signals matters just as much as spotting the entry - our guide to sell discipline and trailing stop strategy covers the other half of that equation.
Disclaimer: This analysis is for educational purposes only. Market microstructure and institutional order flow are complex fields with significant risks. Trading based on institutional footprints involves the risk of loss and should be approached with a professional risk management strategy.
Share now









Key takeaways
- Institutional liquidity traps occur when a fund's required trading volume exceeds the immediate depth available at a given price level, forcing execution off the public order book.
- A block trade is officially defined by NYSE Rule 127.10 as at least 10,000 shares or $200,000 in value, whichever is less, though practical detection thresholds can trigger around $50,000 or 5,000 shares in modern electronic markets.
- Pure dark pool (ATS) volume runs roughly 15 to 18 percent of total U.S. equity volume, but total off-exchange trading - including wholesaler internalization - reaches 40 to 45 percent, with some 2026 quarterly readings closer to 59 percent, according to FINRA ATS transparency data.
- Hidden block trades execute through Alternative Trading Systems (ATS) and dark pools; trades must reach FINRA's Trade Reporting Facility within 10 seconds, though aggregate ATS data itself publishes on a two-week delay.
- Roughly 30 to 50 active ATS venues operate in the U.S., but the top 10 pools handle an estimated 70 percent of all reported ATS volume.
- Institutions use hidden execution for four core reasons: market impact reduction, anonymity, price stability, and sourcing liquidity in illiquid names.
- The iceberg order technique slices massive parent orders into small visible increments, automatically replenishing as each slice fills.
- Michael Kyle's 1985 model of continuous auctions explains the information asymmetry underlying dark pool execution.
- Buyer-initiated block trades tend to carry more persistent price impact than seller-initiated blocks, per Chan and Lakonishok's 1993/1995 research on institutional trading behavior.
- Copeland and Galai's 1983 research shows market makers widen spreads during volatility to protect against informed institutional traders.
- The SEC finalized its order execution disclosure rule in March 2024, while the more consequential order competition rule remains unfinished; SEC enforcement actions against off-exchange venues rose to roughly 14 in fiscal year 2025, nearly double the 2018-2023 annual average.
- Valid order-block footprint detection requires displacement, volume confirmation, and a break of market structure (BOS).
Sources
- FINRA ATS Transparency Data https://www.finra.org/filing-reporting/otc-transparency
- SEC Rule 605 FAQ, Regulation NMS https://www.sec.gov/rules-regulations/staff-guidance/trading-markets-frequently-asked-questions/frequently-asked-questions-rule-605-regulation-nms
- SEC Press Release - Rule to Enhance Competition for Individual Investor Order Execution https://www.sec.gov/news/press-release/2022-225
- Dark Pool (Wikipedia) https://en.wikipedia.org/wiki/Dark_pool
- Market Microstructure overview, University of Bath https://people.bath.ac.uk/mnsak/Microstructure.pdf
- Published 2026-08-02 19:44
- Modified 2026-08-02 19:44

-
Redaction