

-
 PRO
PRO -
 Redaction
Why net-zero needs 6 billion tons of metal
Net-zero by 2050 needs 6 billion tons of metal, six times today's use. We break down the copper, lithium and rare earth gap behind the clean energy shift.
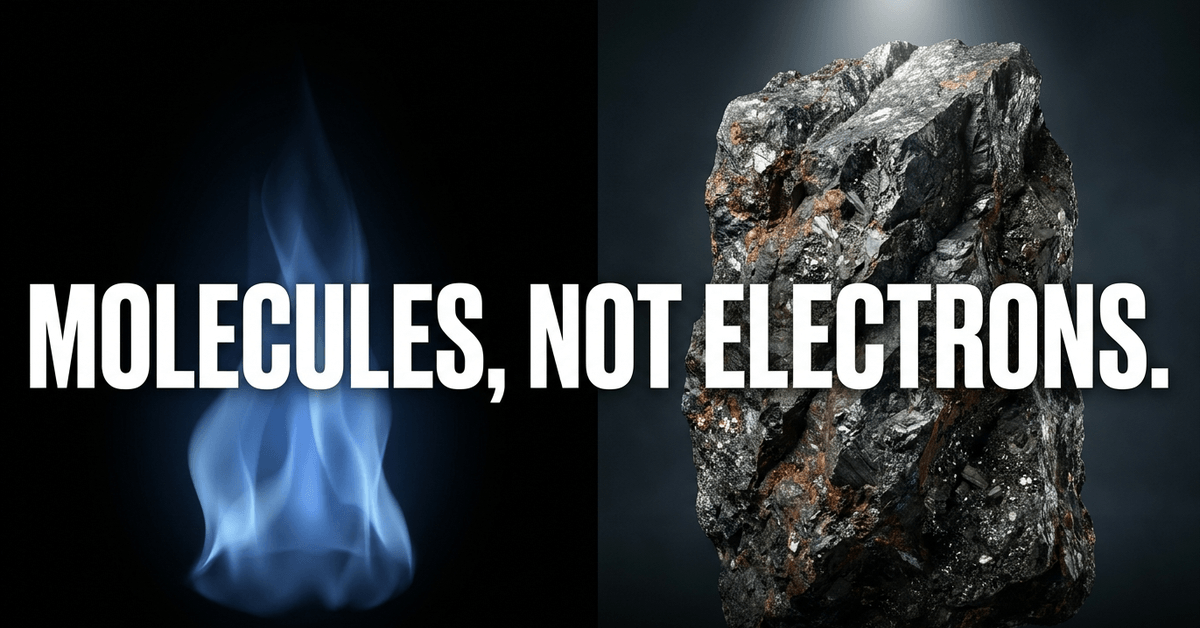
The global net-zero emissions energy system is frequently framed as a transition from molecules to electrons. A forensic audit of the underlying infrastructure tells a different story. It is more accurately described as a transition from fuel-intensive systems to mineral-intensive systems. The physical reality of low-carbon technology is defined by a significant increase in metals intensity per megawatt (MW) of installed capacity. Unlike fossil fuel power plants, which require continuous streams of fuel but relatively modest initial material inputs, renewable energy technologies are front-loaded with massive mineral requirements.
The average amount of minerals needed for a new unit of power generation capacity has increased by 50% since 2010. That trend is accelerating as renewables take a larger share of the global energy mix. To reach net-zero targets, the world must source approximately 6 billion metric tons of metals between 2024 and 2050 - roughly double the demand of a baseline scenario where climate targets go unmet. The IEA's most recent modelling, published in its Global Critical Minerals Outlook 2025, sketches a similarly steep curve even under its more conservative Stated Policies Scenario: lithium demand grows fivefold by 2040, graphite and nickel demand double, and cobalt and rare earth demand rise 50-60%. Under faster-moving policy scenarios, the multiples climb well beyond that. This disconnect between climate ambition and mining throughput defines the primary bottleneck of the energy transition.
The physics of mineral intensity across energy technologies
The fundamental difference between conventional and clean energy lies in the material density of the generation asset itself, not just its fuel. Natural gas plants are remarkably efficient in terms of mineral use per unit of output - the infrastructure is comparatively lean, and the ongoing fuel supply does the rest of the work. Onshore wind flips that equation. An onshore wind plant requires roughly nine times more mineral resources than a gas-fired plant of the same capacity. Offshore wind pushes the disparity further still, since marine environments demand heavier structural support, corrosion-resistant components, and far more extensive subsea cabling.
Electricity networks compound the picture. Grid infrastructure - the wires, transformers, and substations that move power from generation to consumption - already accounts for roughly 70% of today's mineral demand from the energy technologies under IEA review, even as its share gradually declines relative to faster-growing sectors like electric vehicles and storage. Hydropower and bioenergy sit at the opposite end of the intensity spectrum, each drawing only about 2% of total copper demand from low-carbon power capacity additions. Nuclear power similarly registers as comparatively mineral-light: its total mineral demand, mostly chromium, copper, and nickel, is projected to grow by around 35% over 2020 levels by 2040 under an accelerated scenario - a modest figure next to wind and solar.
Wind turbine material requirements
Wind energy is one of the most resource-demanding sectors in the new energy economy. A single 3 MW wind turbine is a massive consumer of industrial materials. The assembly typically requires:
- 335 tons of steel for the tower and nacelle
- 4.7 tons of copper for the generator and wiring
- 3 tons of aluminum
- 2 tons of rare earth elements for permanent magnets
- 1,200 tons of concrete, primarily sourced from limestone
Onshore wind facilities average a critical mineral intensity of roughly 10 tons per MW. Offshore wind sits at the upper limit of current metal intensity, at approximately 15.5 tons of critical minerals per MW. Modern 15 MW offshore turbines, now entering commercial deployment in the North Sea and off the US East Coast, carry roughly 30 tons of copper apiece in their generators, transformers, and internal wiring - a figure that scales with turbine size rather than shrinking as manufacturers chase efficiency. Copper demand for offshore wind can reach 8,000 kg per MW, driven by the necessity of subsea cabling and complex transmission interfaces. It's worth noting the IEA's own modelling flags wind - and offshore wind specifically - as the technology bolstering the sharpest rise in low-carbon power mineral demand through 2040.

Solar photovoltaics and the silicon-copper nexus
Solar photovoltaic (PV) technology, while less steel-intensive than wind, still carries a critical mineral intensity of approximately 7 tons per MW. The composition of a standard solar panel is largely glass (70%), followed by polymers (10%), aluminum (7%), and silicon (4%). Copper accounts for roughly 1% of the panel's weight but is essential for electrical conductivity.
Copper demand from solar PV is expected to nearly triple by 2040 under the IEA's Sustainable Development Scenario. Advances in cell technology may reduce the intensity of silver and silicon per panel, but the sheer volume of planned installations ensures absolute demand for these materials keeps climbing regardless. The scalability of solar is thus inextricably linked to the mining sector's capacity to deliver refined copper and high-purity silicon at scale - a constraint that panel efficiency gains alone cannot solve.
Deep dive into specific mineral demand projections
The transition relies on a narrow basket of critical minerals, each facing its own supply-chain pressures. The projected growth rates for these materials through the middle of the century are unprecedented in the history of industrial mining, and the IEA's 2025 market review confirms the pace is not slowing: lithium demand rose by nearly 30% in 2024 alone, well above the roughly 10% annual growth rate the market saw through the 2010s, while nickel, cobalt, graphite, and rare earth demand each climbed 6-8% over the same year.
Lithium: the centerpiece of mobility
Lithium demand is projected to grow more than 40 times under the IEA's Sustainable Development Scenario by 2040, with some projections putting the increase above 1,500% by 2050. Electric vehicles and battery storage systems are the primary drivers of this surge. By 2040, clean energy technologies could account for the overwhelming majority of total global lithium demand - a complete transformation of a market historically dominated by ceramics and glass manufacturing.
The supply side is showing early signs of diversification. The share of mined lithium supply from the top three producing countries is set to fall below 70% by 2035, down from over 75% in 2024, as new sources come online. Refining is a different story. China is projected to still supply over 60% of refined lithium by 2035, even as mining diversifies. Extraction and processing, in other words, are decoupling - and that gap is where much of the strategic risk now sits.
Lithium prices have also told their own story of boom and correction. Prices fell 20-40% across critical minerals in 2024, with lithium alone dropping roughly 85% from its 2022 peak as oversupply from new Australian and Chinese production caught up with slower-than-expected EV sales growth. That price collapse triggered a pullback in exploration spending - down about 10% in 2024 - which is precisely the kind of underinvestment that tends to seed the next shortage rather than prevent it.
Copper: the nervous system of the transition
Copper is perhaps the most critical bottleneck of all. It's essential to nearly every electricity-related technology, from high-voltage transmission lines to EV motors. In the Net Zero Emissions scenario, copper demand for clean energy is estimated to grow from roughly 5 million tons today to around 50 million tons by 2050. More copper will be needed between now and 2050 for the energy transition than has been produced in the last 4,000 years combined. The comparison is based on projected demand requirements for the energy transition specifically, set against estimated cumulative historical copper production going back to antiquity - it is a measure of industrial scale, not a literal accounting equivalence, and it excludes copper demand from other sectors such as construction, electronics, and general manufacturing.
Even outside pure climate-driven demand, the copper math has gotten harder in the past year. The IEA now projects total global copper demand climbing from roughly 27 million metric tons in 2024 to about 37 million metric tons by 2050 under current policy trajectories, but the more pressing figure is on the supply side: based on today's project pipeline, the IEA warns of a potential 30% supply shortfall by 2035, driven by declining ore grades, rising capital costs, a thin pipeline of new discoveries, and permitting delays that stretch across nearly two decades. S&P Global's own modelling arrives at a comparable destination by a different road, projecting total global copper demand climbing to 42 million metric tons by 2040 and flagging a potential shortfall approaching 10 million metric tons without meaningful supply expansion.
Part of what has changed is the emergence of a demand source barely on anyone's radar five years ago: artificial intelligence infrastructure. A single 1-gigawatt AI data center can require up to 50,000 tons of copper for power distribution, grounding, and cooling systems alone, and industry estimates put total data center copper demand at roughly 475,000 tons in 2026, up from around 500,000 tons annually just a couple of years earlier as facility density has increased. This figure refers to the copper used inside the facility itself - power distribution, grounding, and cooling - and does not include the additional copper consumed by grid connections, substations, and transmission upgrades built to serve the campus; as the following section notes, those external works can push the total footprint per megawatt several times higher. Wood Mackenzie estimates that roughly 700,000 tons of copper will go into data centers globally between now and 2030 for the "box itself," while Trafigura's analysts put the broader AI-and-data-center demand addition as high as 1 million tons by the same year. Grid connections, transformers, and transmission upgrades tied to that buildout may end up consuming even more copper than the data centers themselves. This is a genuine structural shift: copper's story is no longer just a renewables story.
The physical market has already tipped into deficit. The International Copper Study Group has flagged a global refined copper market shortfall of around 150,000 metric tons for 2026, reversing what had been forecast as a surplus of more than 200,000 tons only a year earlier. Some banks see the gap widening further still - UBS has forecast deficits exceeding 400,000 tons in 2026 as mine disruptions in Chile, Peru, and Indonesia collide with rising demand. Copper prices have moved accordingly, surging more than 40% over the past year and briefly touching all-time highs above $14,500 per metric ton in mid-2026, with some banks forecasting a run toward $15,000 as the supply-demand imbalance persists.
Recycling offers only partial relief. Even aggressive recycling strategies are projected to reduce primary copper supply requirements by around 10% by 2040 - a meaningful contribution, but nowhere near enough to close a gap measured in tens of millions of tons. Closing the wider investment gap will require serious capital: the IEA estimates that mining and refining projects across all critical minerals need somewhere between $500 billion and $800 billion in new investment by 2040 just to keep pace with stated policy goals, and BloombergNEF's independent modelling puts the figure closer to $2.1 trillion once refining and midstream capacity are included.
Nickel, cobalt and manganese
Battery chemistries continue to evolve, but demand for cathode materials remains high across the board. Nickel demand is projected to grow roughly 40 times by 2040 under the SDS. Beyond batteries, nickel plays an outsized role in geothermal power - accounting for around 80% of nickel demand in low-carbon power generation - and in emerging hydrogen infrastructure.
Cobalt demand growth is more tempered, thanks to the industry's shift toward lower-cobalt battery chemistries such as NMC 811, which trade some energy density for reduced reliance on a mineral concentrated almost entirely in the Democratic Republic of the Congo. That shift has picked up further momentum from an unexpected direction: sodium-ion batteries, which use no lithium or cobalt at all, are moving from pilot lines into commercial-scale production for stationary storage and entry-level EVs, alongside a continued expansion of cobalt-free lithium iron phosphate (LFP) chemistries. Neither technology eliminates cobalt demand outright, but both blunt what would otherwise be an even steeper growth curve. Manganese demand is expected to climb roughly 15 times between now and 2050, a figure that has drawn less public attention than lithium or copper but carries similar supply-chain fragility, particularly around high-purity manganese sulphate used in battery cathodes.
Sectoral drivers and the EV multiplier
The transport sector is the single most significant driver of mineral demand growth. Critical mineral requirements for EVs alone are expected to grow by close to 300 times between 2020 and 2050 under the Net Zero Emissions scenario. EVs and battery storage together are set to account for roughly half of total mineral demand growth from clean energy technologies over the next two decades.
That growth extends beyond the battery pack. EV motors require high-performance permanent magnets built with rare earth elements like neodymium and dysprosium, and demand for these elements is projected to grow more than sevenfold by 2040. The magnet supply chain, in particular, has become one of the tightest chokepoints in the entire transition. China's share of global sintered permanent magnet production has risen from around 50% two decades ago to roughly 94% today, giving Beijing effective control over the components that drive the most powerful motors used in EVs, wind turbines, industrial systems, and defense applications alike.
"Reliance on a small number of suppliers increases vulnerability to shocks and disruptions, be it from extreme weather, technical failure or trade disruptions," the IEA noted in its analysis of critical mineral concentration risk. "This is no longer just a theoretical concern."
That warning proved prescient, and the timeline since has been anything but stable. Beginning in April 2025, China introduced a first wave of export controls on rare earth elements and related processing equipment. A second, broader round followed in October 2025, tightening licensing requirements across a wider set of heavy rare earths. The knock-on effects reached automotive plants within months: European licensing approval rates for rare earth magnet applications fell from over 90% to below 25% during 2025, and manufacturers including Honda reported production pauses tied directly to magnet and semiconductor shortages heading into 2026. Under a trade agreement reached in November 2025, Beijing suspended the October measures for one year, through November 2026, and agreed to issue general licenses against the earlier April restrictions - a truce that eased the immediate crisis without resolving the underlying dependency. The reprieve has proven partial and uneven: in June 2026, China added specific Western rare earth producers to its export control entity list, and separate revisions to its 2026 licensing catalogue introduced new controls on additional elements including samarium, gadolinium, and lutetium, due for full enforcement in November 2026. The IEA has since estimated that a severe, sustained disruption to rare earth supply could put more than $6.5 trillion of downstream economic activity at risk globally, with automotive manufacturing facing the single largest exposure at over $3 trillion outside China.
More broadly, the top three producing countries for lithium, cobalt, and rare earth elements control a disproportionate share of global output, and this geographic concentration only intensifies at the refining stage. China is the dominant refiner for 19 of the 20 strategic minerals the IEA tracks closely, holding an average market share of around 70%. For minerals like gallium, graphite, manganese, and rare earths, China's refining share climbs above 90%. This concentration has not eased with time - it has worsened. Between 2020 and 2024, the average market share of the top three refining nations for key energy minerals rose from around 82% to 86%, with nearly all of that growth traced back to a single dominant supplier in each case.

Share now









Key takeaways
- Reaching net-zero by 2050 requires sourcing approximately 6 billion metric tons of metals between 2024 and 2050 - roughly double the demand of a baseline, non-climate-aligned scenario.
- Offshore wind is the most mineral-intensive power source, requiring approximately 15.5 tons of critical minerals per megawatt, compared to roughly 10 tons per MW for onshore wind and 7 tons per MW for solar PV.
- An onshore wind plant requires roughly nine times more mineral resources than a gas-fired plant of equivalent capacity.
- Copper demand for the energy transition could exceed the total amount of copper mined in the last 4,000 years combined.
- The IEA projects a potential 30% copper supply shortfall by 2035 based on the current mine project pipeline, driven by declining ore grades, rising capital costs, and long permitting timelines.
- The global refined copper market is projected to run a deficit of around 150,000 metric tons in 2026, with some banks forecasting a gap exceeding 400,000 tons.
- A single 1-gigawatt AI data center can require up to 50,000 tons of copper for power distribution, grounding, and cooling - a demand source barely factored into transition models a few years ago.
- Lithium demand is projected to grow more than 40 times by 2040 under the IEA's Sustainable Development Scenario, with some estimates putting the total increase above 1,500% by 2050.
- China is the dominant refiner for 19 of the 20 strategic minerals the IEA tracks, holding an average market share of around 70% - and over 90% for gallium, graphite, manganese, and rare earths.
- China's share of global sintered permanent magnet production has risen from around 50% two decades ago to roughly 94% today.
- Critical mineral requirements for electric vehicles alone are projected to grow by close to 300 times between 2020 and 2050.
- Meeting projected mineral demand requires an estimated $500 billion to $800 billion in new mining and refining investment by 2040, according to the IEA.
Sources
- IEA Global Critical Minerals Outlook 2025 https://www.iea.org/reports/global-critical-minerals-outlook-2025
- IEA - The Role of Critical Minerals in Clean Energy Transitions https://www.iea.org/reports/the-role-of-critical-minerals-in-clean-energy-transitions/mineral-requirements-for-clean-energy-transitions
- S&P Global - Copper in the Age of AI: Challenges of Electrification https://www.spglobal.com/en/research-insights/special-reports/copper-in-the-age-of-ai
- World Bank - Climate-Smart Mining: Minerals for Climate Action https://www.worldbank.org/en/topic/extractiveindustries/brief/climate-smart-mining-minerals-for-climate-action
- Columbia University Center on Global Energy Policy - Critical Minerals Demand Growth in the Net Zero Scenario https://www.energypolicy.columbia.edu/qa-critical-minerals-demand-growth-in-the-net-zero-scenario/
- Published 2026-07-28 23:07
- Modified 2026-07-28 23:07

-
Redaction