



-
 Redaction
Bull and bear markets: How cycles really work
Learn how bull and bear market cycles work, what drives each phase, and how institutional investors use cycle analysis to manage risk effectively.
The architecture of institutional market cycles
Financial markets do not move in linear paths. They operate through recurring sequences of expansion and contraction known as market cycles - the byproduct of complex interactions between economic fundamentals, corporate earnings, monetary policy, and the volatile nature of participant psychology. For those operating within institutional frameworks, understanding these structures is not about predicting the future. It is about identifying the current environment to manage risk exposure effectively.
These patterns reflect the natural respiration of a global economy, where periods of growth inevitably lead to overvaluation, followed by necessary corrections that reset the baseline for the next leg of expansion.
Market cycles have been observed and documented for centuries. The tulip mania of 1637, the South Sea Bubble of 1720, and the railroad speculation of the 1840s all share the same structural DNA as the dot-com bubble of the late 1990s and the credit crisis of 2008. The actors change, the underlying instruments evolve, but the fundamental sequence - optimism leading to overextension, correction restoring equilibrium - remains a constant of market behavior. Understanding this constancy is the first principle of institutional capital deployment.
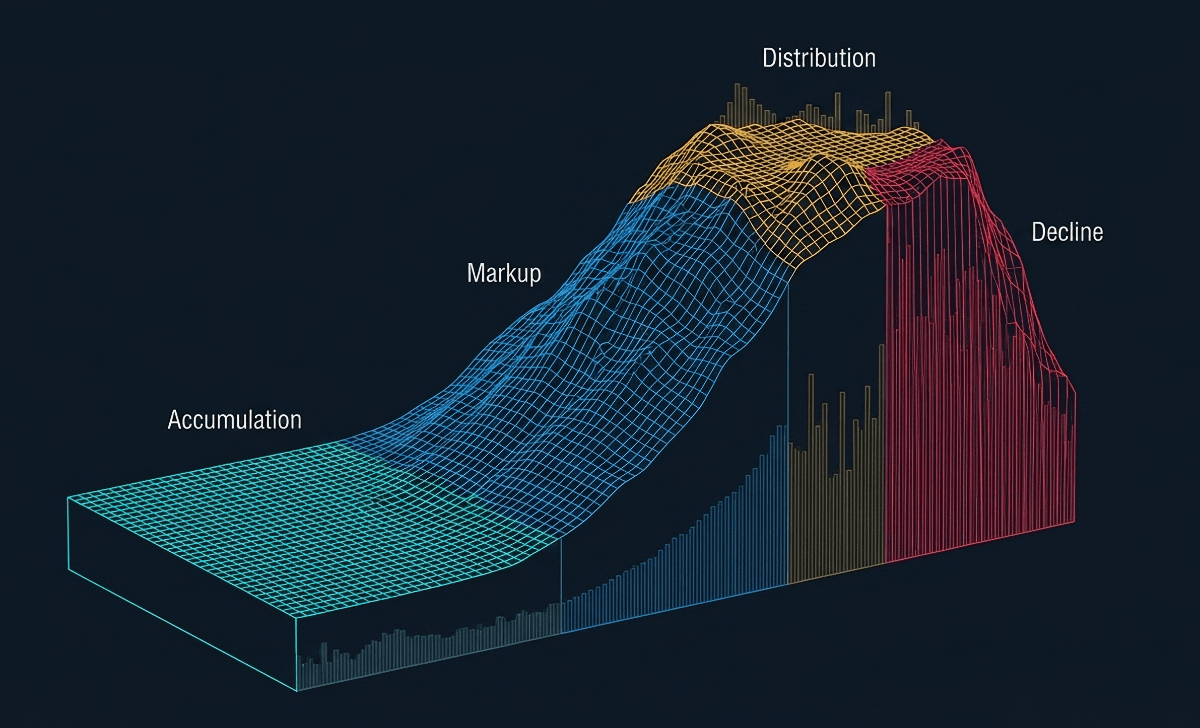
The four phases of the market lifecycle
To analyze market movement with clinical precision, the cycle must be decomposed into four specific stages. Each phase possesses unique liquidity characteristics and sentiment profiles that dictate price action.
Accumulation phase
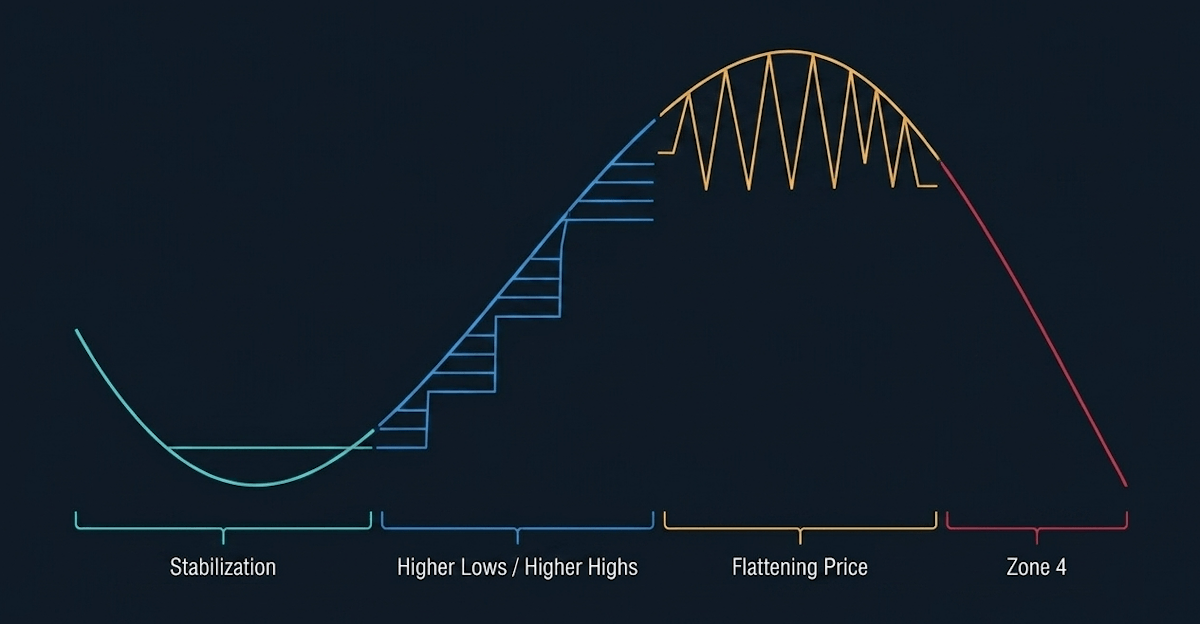
This stage represents the trough of the cycle. It occurs after a period of significant mark-down where pessimism has reached its zenith. During this time, the general public is typically fearful - yet institutional actors begin building positions in undervalued assets. Prices stabilize as selling pressure exhausts itself, though trading volumes often remain muted.
Price-to-earnings ratios compress to historically low levels relative to long-term averages, and dividend yields on quality equities expand to levels that attract value-oriented capital. The distinguishing feature of this phase is a divergence between price action - which is stabilizing - and prevailing sentiment, which remains deeply negative. News flow is typically still bearish, and retail investor outflows continue even as institutional accumulation quietly begins.
Markup phase
Also referred to as the momentum phase, this period is characterized by a definitive trend reversal. Higher lows and higher highs become the standard. As optimism replaces skepticism, broader participation drives prices upward. Economic data often begins to support the price action, confirming the transition into a sustained bull market.
Volume expands as new buyers enter the market. Corporate earnings revisions trend upward, analyst upgrades accelerate, and initial public offerings begin to return. This phase often contains intermediate corrections of 10% to 15%, which serve to shake out weak hands and reset sentiment before the advance resumes. The markup phase is typically the longest phase in duration and produces the majority of a full cycle's total return.
Distribution phase
At this juncture, the market peaks. Volatility increases as the tug-of-war between remaining buyers and profit-taking sellers intensifies. Sentiment is often characterized by euphoria among retail participants, while experienced investors begin exiting positions.
This phase is marked by a flattening of price curves, increased divergence between indexes, and a deterioration in market breadth - meaning that fewer and fewer individual securities are participating in the continuation of the advance even as major indexes maintain their highs. Valuation multiples reach extreme levels relative to historical norms, and speculative activity moves into lower-quality assets as investors seek returns in progressively riskier instruments. IPO volumes typically peak during this phase, and financial media coverage reaches its maximum positive intensity.
Decline phase
Commonly known as the mark-down, this is the liquidation stage. Once the support levels established in the distribution phase fail, price action turns aggressive to the downside. Panic selling often accelerates the decline as risk aversion becomes the dominant psychological driver. Credit spreads widen as concern about default risk rises, and liquidity conditions tighten across asset classes.
This phase continues until the market reaches a valuation level that invites a new accumulation period. Unlike the gradual distribution that precedes it, the mark-down phase often occurs with sudden, sharp dislocations interspersed with violent counter-trend rallies - so-called bear market bounces - which can trap investors who mistake temporary recoveries for a genuine reversal.
The role of interest rates and monetary policy
No analysis of market cycles is complete without examining the role of central bank policy. Interest rates function as the primary lever through which monetary authorities influence the cost of capital, and by extension, asset valuations. The relationship between the Federal Reserve's policy rate and equity market cycles is well documented.
Rate-cutting cycles, which lower borrowing costs for businesses and consumers, typically serve as an accelerant during the accumulation and early markup phases. Conversely, tightening cycles compress valuation multiples and increase the discount rate applied to future earnings, exerting downward pressure on asset prices.
The yield curve - the spread between short-term and long-term Treasury yields - serves as a particularly reliable leading indicator across cycles. An inverted yield curve, where short-term rates exceed long-term rates, has preceded each of the last eight U.S. recessions. This inversion signals that markets expect growth to slow and that the central bank will eventually be forced to cut rates, which has historically been associated with the transition from the distribution phase into the early stages of the mark-down.
Mechanics of the bull market regime
A bull market represents a period of sustained price appreciation and economic vitality. While the term is often used loosely in financial media, its institutional definition usually hinges on a 20% increase from recent lows in major indexes such as the S&P 500 or the Nasdaq Composite. These regimes are the engines of wealth creation, fueled by positive feedback loops between corporate profitability and investor confidence.
Key indicators of sustained expansion
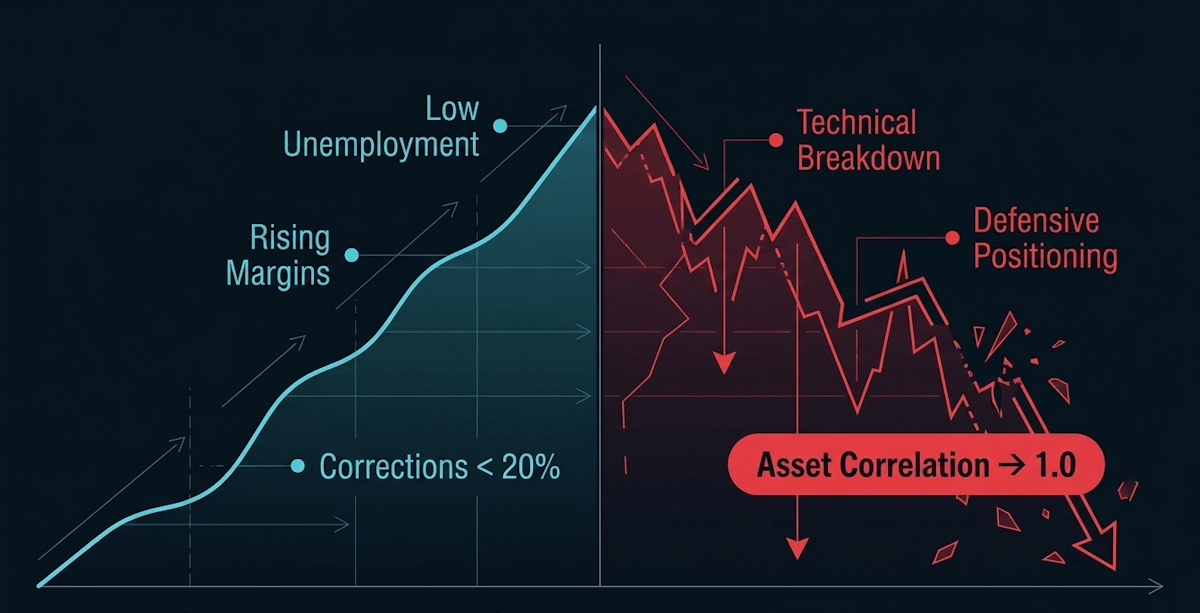
Bull markets are defined by several key metrics. First, sustained growth in asset prices is typically backed by robust economic indicators, including low unemployment rates and increasing corporate profit margins. Consumer spending remains healthy, and the cost of capital is often conducive to business investment. Credit conditions are accommodative, and the spread between investment-grade corporate bonds and government securities remains narrow, reflecting confidence in corporate balance sheets.
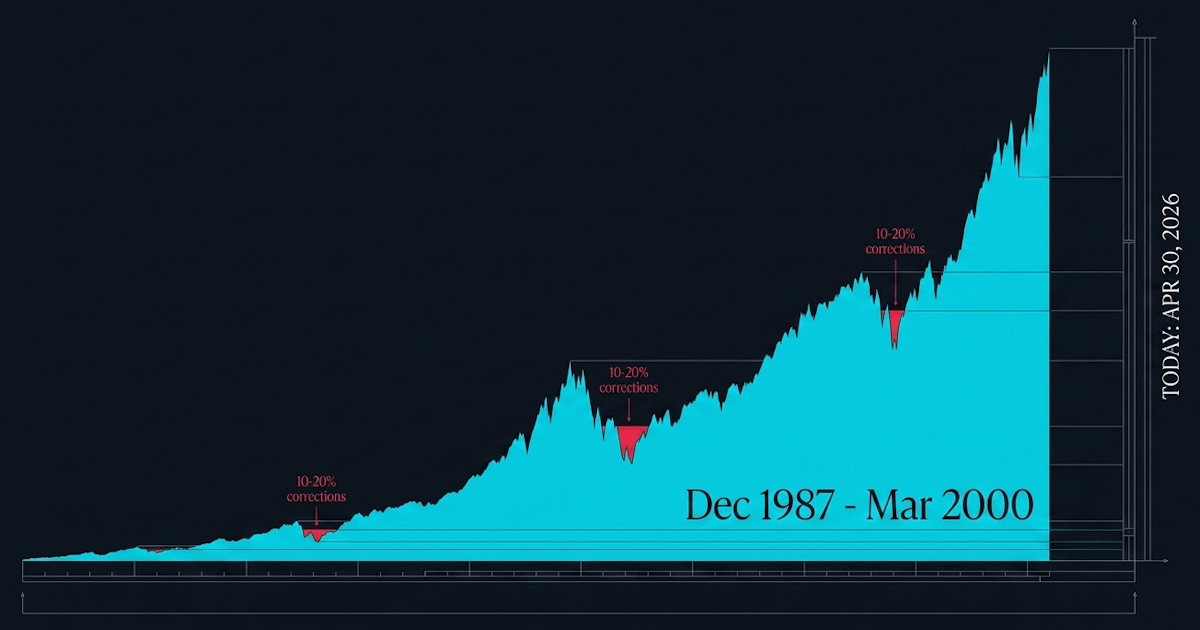
Second, market corrections - defined as drops between 10% and 20% - are usually short-lived and viewed as buying opportunities rather than the start of a collapse. Data from the S&P 500 Price Index shows that since 1946, bull markets have delivered an average cumulative return of 151% over an average duration exceeding five years. This compares starkly with the average bear market, which has produced losses of approximately 34% over an average duration of roughly 16 months.
Third, breadth indicators provide important confirmation signals. In a healthy bull market, advances in the broader index are supported by wide participation from constituent securities. When the advance narrows - that is, when a declining number of stocks drive an index to new highs - it is often an early warning that the distribution phase is approaching. The advance-decline line, which tracks the net difference between advancing and declining issues on a daily basis, is one of the most widely used breadth measures for this purpose.
The psychology of growth
Sir John Templeton famously observed that "bull markets are born on pessimism, grown on skepticism, mature on optimism, and die on euphoria." The early stages are often met with extreme doubt, as the memory of the previous decline remains fresh. Only as the markup phase progresses does the narrative shift toward universal acceptance of the growth trend.
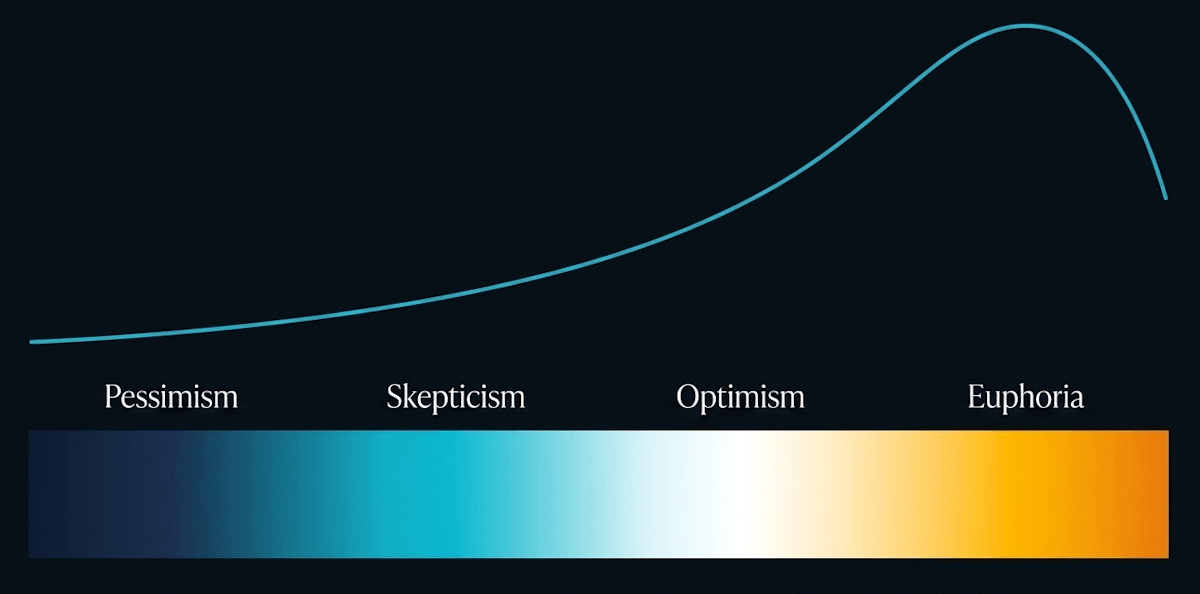
The longest bull market on record ran from December 1987 until the dot-com crash in March 2000, spanning over 12 years - a duration that highlights the inherent resilience of expansionary phases when compared to their contractionary counterparts. During this period, the S&P 500 appreciated by more than 580%, driven by the twin forces of technological innovation and the globalization of trade.
The cycle that followed, from March 2009 to February 2020 - interrupted only by the COVID-19 pandemic shock - lasted approximately 11 years and produced comparable gains, driven by the combination of near-zero interest rates and transformative advances in cloud computing, mobile technology, and digital commerce.
Sector rotation within bull markets
One of the most actionable frameworks within the bull market regime is the concept of sector rotation. Different sectors of the economy typically outperform at different stages of the economic and market cycle.
Early in the markup phase, cyclical sectors - such as industrials, materials, and consumer discretionary - tend to lead, as they are most sensitive to an acceleration in economic activity. As the expansion matures and monetary policy begins to tighten, investors typically rotate into more defensive sectors, such as healthcare, consumer staples, and utilities, which offer more stable earnings streams and are less sensitive to rising interest rates.
Understanding these rotational dynamics allows institutional managers to tilt sector exposure in a manner consistent with the prevailing phase of the cycle, capturing incremental returns while managing downside risk.
The anatomy of the bear market contraction
Conversely, a bear market is a period of sustained decline, technically defined as a 20% or greater drop from recent highs. These periods are characterized by a breakdown in technical structures, an expansion of credit spreads, and a broad shift toward defensive positioning across institutional portfolios.
The term itself has 18th-century roots: speculators who sold stock they did not yet own were known as "bearskin jobbers," derived from the old proverb warning against selling a bear's skin before catching the animal. The popular but historically unsupported explanation - that the term derives from the "downward swipe of a bear's paw" - is a retrospective rationalization rather than a documented etymology.
Statistical profiles of downturns
Historical data provides a sobering view of market contractions. Since 1946, there have been 13 bear markets in the U.S. equity market. The average duration for these events is approximately 16 months, with an average peak-to-trough price decline of 34%. While significantly shorter in duration than bull markets, bear markets are measurably more volatile on a day-to-day basis.

The velocity of the decline is often far higher than the velocity of the preceding advance, as fear is a more immediate and potent catalyst than greed. Historically, major indexes have posted some of their largest single-day percentage gains during bear markets, not bull markets - a counterintuitive fact that underscores the danger of attempting to time re-entry after large drawdowns.
During these periods, correlations between different asset classes often converge toward 1.0, as investors sell liquid assets across the board to raise cash, temporarily eliminating the diversification benefits that normally justify holding a multi-asset portfolio.
Not all bear markets are created equal. Cyclical bear markets, driven by the natural ebb of the business cycle, tend to be less severe and of shorter duration than structural bear markets, which are caused by fundamental imbalances in the financial system - such as the excessive leverage that drove the 2008 financial crisis. Event-driven bear markets, triggered by sudden external shocks such as the COVID-19 pandemic sell-off of 2020 or the 1987 Black Monday crash, are typically the shortest and sharpest in duration, with recoveries that can be rapid once the initial panic subsides and policymakers respond.
Disconnecting recessions from bear markets
It is a common misconception that a bear market and an economic recession are synonymous. While the two often overlap, they are distinct phenomena. Historical data shows that since 1928 there have been 27 bear markets but only 15 formal recessions, meaning that roughly 44% of bear markets occurred without an accompanying economic contraction.
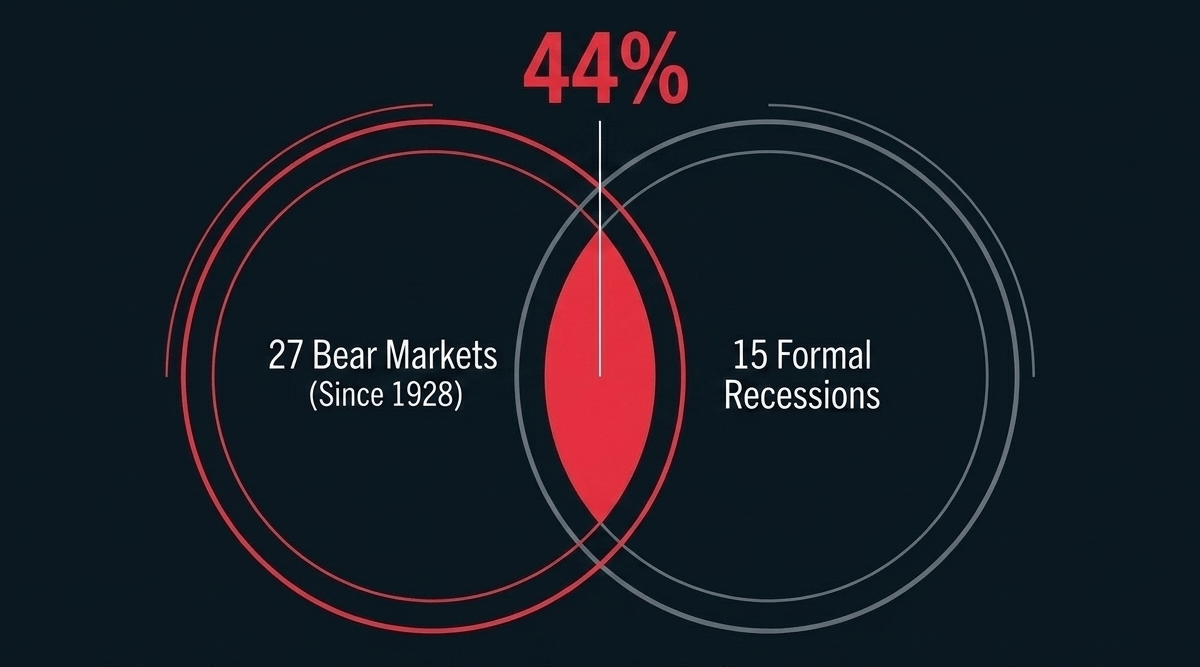
Equity markets serve as leading indicators, often pricing in expected economic pain months before it manifests in GDP figures or employment data. Consequently, a market may enter a bear phase based on anticipated tightening of fiscal policy or interest rate hikes, even if the underlying economy remains technically in expansion for several more quarters.
The reverse also holds: equity markets have frequently begun their recovery well before an official recession has ended, as prices reflect forward-looking expectations of future earnings and growth rather than current economic conditions. This leading property of equity markets is precisely why investors who wait for macroeconomic confirmation before deploying capital often miss a substantial portion of the recovery.
Investor sentiment as a market catalyst
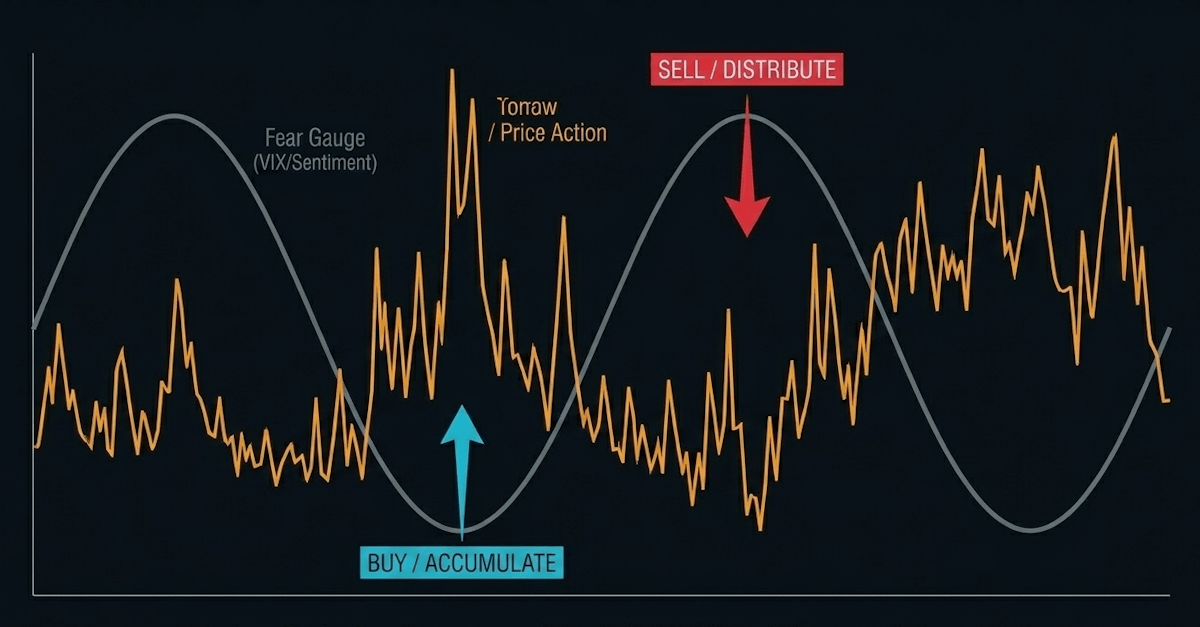
Psychology is the invisible hand that moves the tape. In the professional trading environment, sentiment is tracked as a contrarian indicator. When sentiment reaches extreme levels of euphoria, it usually signals that the distribution phase is nearing completion. Conversely, when fear gauges like the CBOE Volatility Index (VIX) hit extreme highs - a level above 40 has historically been associated with periods of capitulation - it often signals that the mark-down phase is reaching a point of exhaustion.
Measuring and interpreting sentiment
Several quantitative and survey-based tools are used to track sentiment across the cycle:
The AAII Sentiment Survey provides a weekly measure of retail investor bullishness and bearishness, which has historically served as a reliable contrarian signal at extremes. The Investors Intelligence Bull/Bear Ratio tracks the positioning of professional newsletter writers and advisors. The put/call ratio - the proportion of bearish put options purchased relative to bullish calls - provides a real-time read on the hedging activity of options market participants.
The fear and greed index, which aggregates inputs from momentum, market breadth, put/call activity, junk bond demand, and volatility measures, offers a composite view of prevailing sentiment. These tools do not provide precise timing signals; sentiment can remain at extreme readings for weeks or months before a reversal materializes. Their value lies not in timing but in framing the risk environment: when multiple indicators simultaneously signal extreme optimism, the asymmetry of expected returns shifts unfavorably for new buyers, and risk management discipline demands a reduction in exposure.
The structural behavior of institutional versus retail participants
A critical distinction within market cycles is the behavioral difference between institutional and retail participants. Institutional investors - including pension funds, endowments, hedge funds, and sovereign wealth funds - typically operate with formal investment policy statements, risk budgets, and defined rebalancing protocols. These constraints impose a degree of counter-cyclical discipline: as equities appreciate and their weight in a portfolio exceeds target allocations, institutional managers are systematically required to trim exposure and redeploy capital into underperforming assets. This mechanical rebalancing acts as a stabilizing force during the markup phase.
Retail investors, by contrast, tend to exhibit momentum-chasing behavior, increasing equity allocations as prices rise and reducing them during declines - precisely the opposite of what sound risk management would prescribe. Flows into equity mutual funds and exchange-traded funds have historically peaked near market tops and bottomed at or near market troughs, confirming this pattern empirically. The result is a structural transfer of wealth from those who react to cycles emotionally to those who engage with them analytically.
How to position a portfolio across the cycle
Recognizing the current phase of the market cycle has direct implications for portfolio construction. Each stage calls for a different calibration of risk, asset class exposure, and liquidity management.
During the accumulation phase, the priority is building selective exposure to high-quality assets at depressed valuations. Concentration in beaten-down sectors with durable business models - rather than broad-based speculation - has historically produced the strongest risk-adjusted returns over the subsequent cycle. Cash positions accumulated during the prior decline can be deployed methodically rather than all at once, a technique often referred to as dollar-cost averaging into distress.
In the markup phase, the objective shifts to maintaining adequate exposure while managing intermediate volatility. Systematic rebalancing toward target allocations prevents single-position concentration risk as individual holdings appreciate. Investors who reduce exposure prematurely - selling into the first 10% correction of a new bull market - frequently miss the bulk of the cycle's eventual return.
The distribution phase demands heightened vigilance. Reducing gross exposure, shortening portfolio duration, increasing allocation to cash or short-duration fixed income, and adding downside hedges via put options or volatility instruments are the primary tools at this stage. The challenge is that distribution phases can persist for months - or in some cases, over a year - before the mark-down begins, testing the patience of early defensive repositioning.
During the decline phase, capital preservation takes precedence. Avoiding the temptation of early re-entry during bear market bounces is arguably the most difficult discipline, as these counter-trend rallies can be sharp and compelling. Maintaining a watchlist of high-conviction accumulation candidates allows for rapid, decisive deployment once the exhaustion of selling pressure becomes evident across multiple indicators simultaneously.
Common mistakes investors make across market cycles
The cyclical nature of markets creates predictable patterns of behavioral error that recur across every generation of participants. Understanding these pitfalls is as important as understanding the cycle mechanics themselves.
Recency bias is perhaps the most pervasive. Investors who have experienced only one phase of the cycle - particularly those who entered markets during a prolonged markup - systematically underestimate the severity of eventual contractions. The assumption that current conditions represent a permanent new normal is a recurring feature of distribution-phase psychology.
Confirmation bias amplifies this effect. As the distribution phase deepens, investors selectively weight evidence that supports the continuation of the existing trend, while dismissing early warning signals from breadth deterioration, credit spreads, and sentiment extremes. By the time the weight of evidence becomes undeniable, the mark-down is typically already underway.
Capitulation at the trough - the tendency to sell at the point of maximum pain rather than maximum opportunity - is the retail investor's single most costly behavioral pattern. The emotional experience of the decline phase, with its sharp counter-trend rallies followed by new lows, creates a psychological environment in which staying invested feels intolerable even when the analytical case for accumulation is strongest.
The antidote to each of these errors is the same: a written, rules-based investment process that defines in advance how the portfolio will respond to each phase of the cycle, removing discretionary emotional decision-making from the equation at the moments when emotions are most likely to mislead.
Cycle awareness as a long-term edge
Institutional strategies focus on maintaining a detached, clinical approach to these swings. Emotional decision-making - such as panic selling at the bottom of a decline or buying into parabolic moves at the top of a markup - is the primary documented cause of long-term underperformance relative to passive benchmarks.
A sound investment plan must account for the reality that cycles are inevitable. These patterns are not flaws in the system; they are the system itself.
By recognizing the transition from accumulation to distribution, one can adjust risk parameters without succumbing to the volatility of the crowd. Total awareness of the current phase allows for the deployment of capital in a manner that respects historical averages while remaining agile enough to react to idiosyncratic shocks. Strategy must always precede execution, and understanding the cycle is the foundation of that strategy.
Share now









Key takeaways
- Market cycles consist of four distinct phases - accumulation, markup, distribution, and decline - each defined by unique liquidity conditions and investor sentiment profiles.
- A bull market is institutionally defined by a 20% rise from recent lows; since 1946, S&P 500 bull markets have averaged over five years in duration and a cumulative return of approximately 151%.
- Bear markets are defined by a 20% or greater decline from recent highs; since 1946, there have been 13 bear markets averaging approximately 16 months in duration and a 34% peak-to-trough decline.
- The longest bull market on record ran from December 1987 to March 2000 - spanning over 12 years - with S&P 500 gains exceeding 580%.
- Bear markets and recessions are distinct events: since 1928 there have been 27 bear markets but only 15 formal recessions, meaning roughly 44% of bear markets occurred without an accompanying economic contraction.
- Equity markets are leading indicators; they typically begin recovering before a recession officially ends, rewarding investors who deploy capital ahead of macroeconomic confirmation.
- During bear markets, cross-asset correlations converge toward 1.0 as liquidity is drained, temporarily eliminating the diversification benefits of multi-asset portfolios.
- Yield curve inversion - where short-term rates exceed long-term rates - has preceded each of the last eight U.S. recessions and is one of the most reliable leading indicators within the cycle framework.
- Investor sentiment functions as a contrarian indicator; extreme readings on measures such as the VIX (above 40), AAII survey, and put/call ratio have historically flagged major turning points in the cycle.
- Retail investors systematically exhibit momentum-chasing behavior - increasing equity exposure near tops and reducing it near bottoms - representing a structural, recurring transfer of wealth to more disciplined, analytically driven participants.
- The markup phase is typically the longest phase in the full cycle and produces the majority of its total cumulative return.
- Bear market bounces - sharp, short-lived counter-trend rallies within a decline phase - are a consistent feature of contractions and a common trap for investors attempting to time re-entry.
- Event-driven bear markets (triggered by external shocks) are historically the shortest and sharpest, with the fastest recoveries once panic subsides and policy responses are deployed.
- A written, rules-based investment process is the most effective documented countermeasure against recency bias, confirmation bias, and trough capitulation - the three most costly behavioral errors across market cycles.
Sources
- Fisher Investments - Bull markets https://www.fisherinvestments.com/en-us/resource-library/market-cycles/bull-markets
- Hartford Funds - 10 things you should know about bear markets https://www.hartfordfunds.com/practice-management/client-conversations/managing-volatility/bear-markets.html
- Merriam-Webster - The history of bull and bear markets https://www.merriam-webster.com/wordplay/the-origins-of-the-bear-and-bull-in-the-stock-market
- Corporate Finance Institute - Market cycle https://corporatefinanceinstitute.com/resources/economics/market-cycle/
- Britannica Money - Market cycle investing https://www.britannica.com/money/market-cycle-investing
- Published 2026-04-30 22:03
- Modified 2026-05-23 14:35

-
Redaction