

-
 Redaction
Why your brain is wired for investment losses
Neuroimaging confirms the amygdala overrides rational logic during market loss. Data proves inactive portfolios often beat high-turnover accounts.
Most investors believe they are rational. The data suggests otherwise. Decades of behavioral finance research - and the biological architecture of the human brain - reveal that the way we feel about financial losses is fundamentally incompatible with the way long-term wealth is built. Understanding this conflict is not merely academic; it is, for many investors, the difference between matching the market and significantly trailing it.

The psychological framework of loss aversion
Behavioral finance research identifies loss aversion as a primary cognitive bias where the psychological distress associated with a financial loss outweighs the satisfaction derived from an equivalent gain. The canonical estimate, established by Tversky and Kahneman in their 1992 formulation of cumulative prospect theory, places the loss aversion coefficient (λ) at approximately 2.25. Subsequent meta-analyses across hundreds of studies have refined this figure, with recent comprehensive reviews reporting a mean around 1.96 (with a 95% probability interval of roughly 1.82-2.10), though estimates vary meaningfully by context, elicitation method, and population sampled - some analyses in risky-choice contexts yield lower values closer to 1.3.
In practical terms, these estimates indicate that for many investors, a loss of $1,000 generates a negative emotional impact roughly twice as powerful as the positive impact of an equivalent gain.
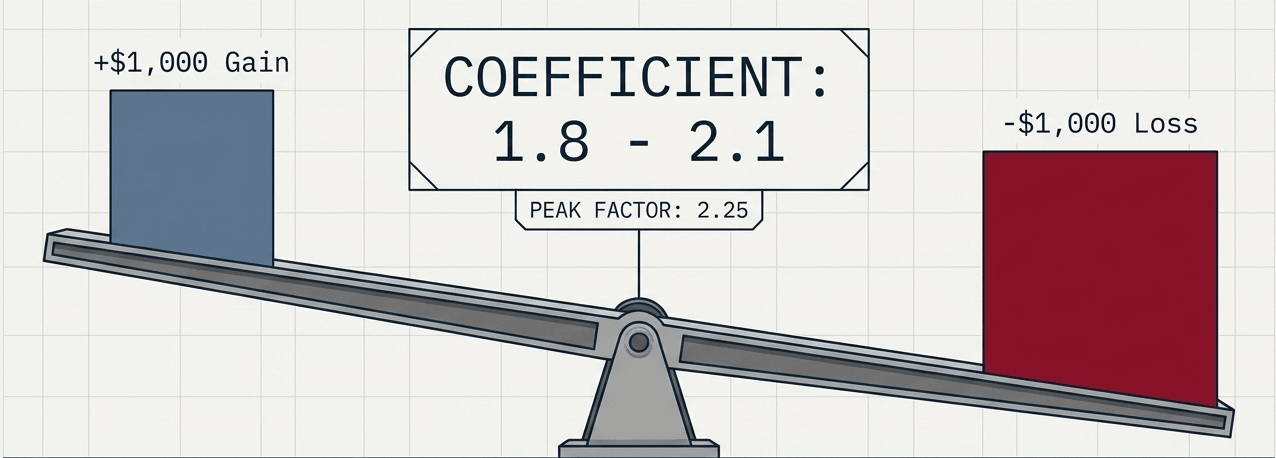
This asymmetry creates a fundamental distortion in decision-making. Investors do not view risk through a linear lens; instead, the prospect of a negative outcome triggers a heightened biological response. Neuroimaging data indicates that the threat of loss activates the amygdala, the region of the brain responsible for threat detection. This activation can override the prefrontal cortex - which manages rational analysis - leading to impulsive or defensive actions that deviate from long-term financial objectives.
Regret aversion and its biological correlates
Closely aligned with loss aversion is regret aversion: a state where the fear of making a wrong choice dictates investment strategy. This bias frequently manifests as a refusal to sell underperforming assets. To sell a losing position is to finalize the error - an act that many investors avoid to escape the associated psychological pain.
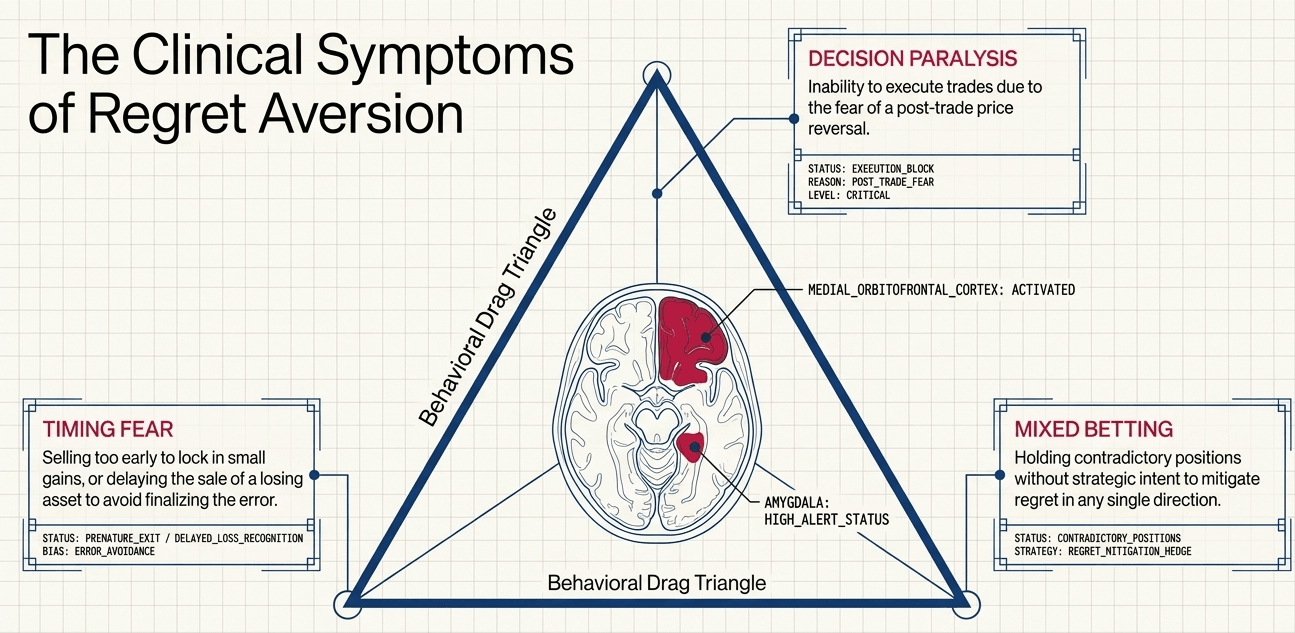
Functional MRI (fMRI) studies provide a biological basis for these behaviors. Neuroimaging research has identified increased activity in the medial orbitofrontal cortex and the amygdala when individuals face choices that could lead to regret. This fear response explains several suboptimal portfolio decisions observed in recent market cycles:
- Decision paralysis - the inability to execute trades due to fear of a post-trade price reversal, leaving capital idle as opportunity passes.
- Timing fear - delaying the sale of an asset until it is too late, or selling too early to lock in small gains while allowing losses to compound.
- Mixed betting - holding contradictory positions without a clear strategic rationale, in an attempt to hedge psychological regret across multiple outcomes rather than optimise for returns.
Each of these behaviours has a shared root: the anticipation of regret is treated by the brain as more threatening than the economic reality of the loss itself.

Empirical evidence of the cost of trading activity
Data consistently highlights the historical outperformance of inactive investors. A landmark ongoing study by Dalbar, Inc. has demonstrated for decades that average equity fund investors consistently underperform the S&P 500 - not because of poor fund selection, but because of when they choose to act.
The 2025 DALBAR Quantitative Analysis of Investor Behavior (QAIB) report found that the average equity investor earned 16.54% in 2024, compared to the S&P 500's 25.02% return - an 848 basis point gap representing the second-largest investor performance shortfall of the past decade. This gap is not explained by fees or fund performance. It is explained by behaviour: buying after rallies and selling into drawdowns.
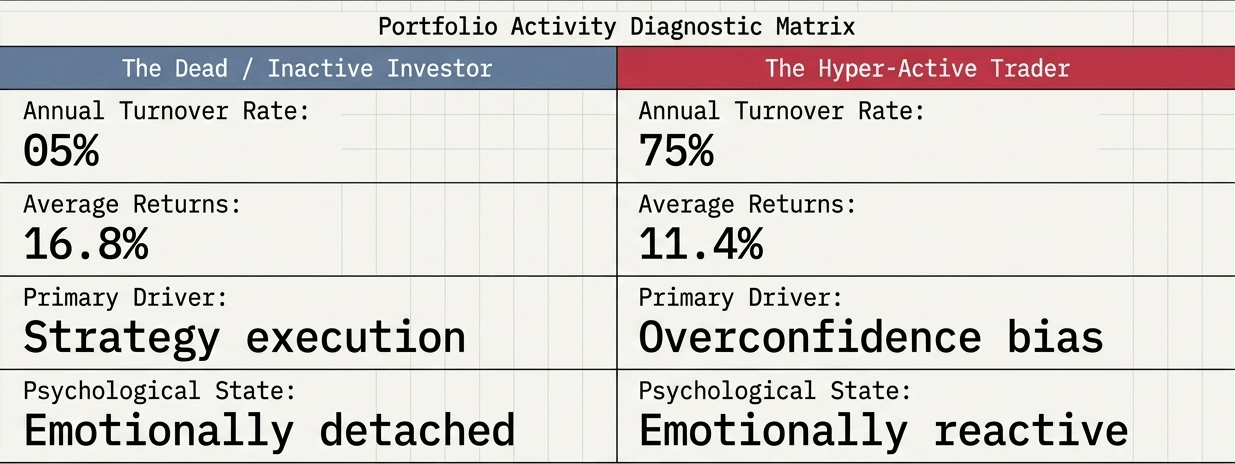
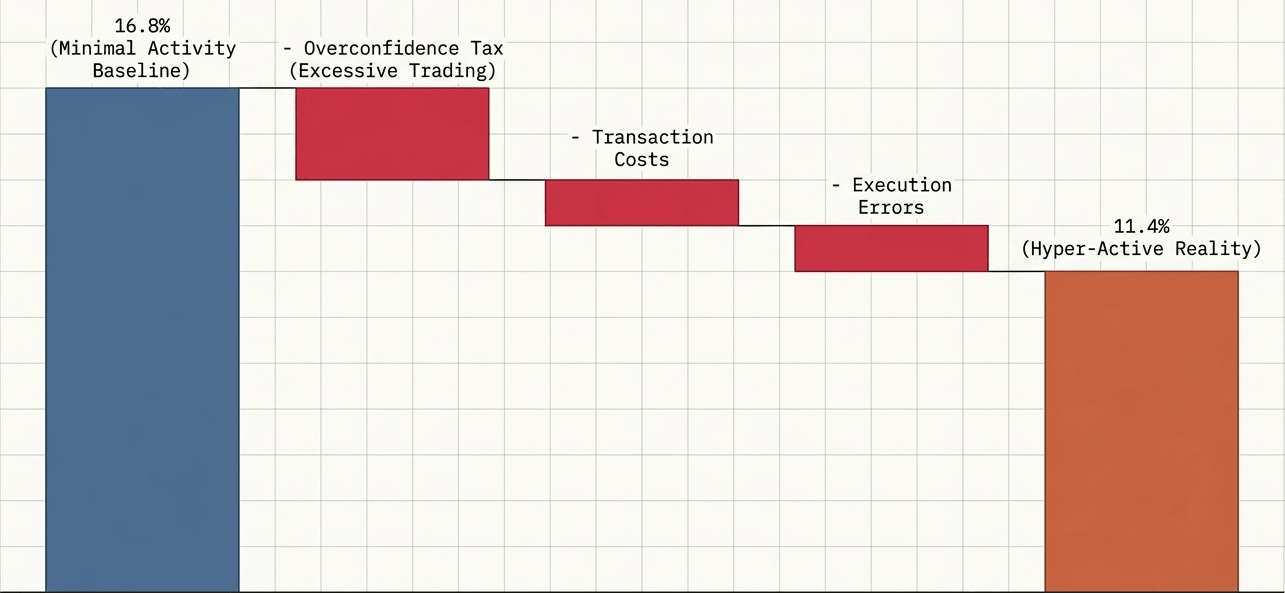
The cost of overtrading is further quantified in the seminal study by Barber and Odean (2000), which analysed 66,465 household brokerage accounts from 1991 to 1996. The most active traders - whose portfolios turned over approximately 75% annually - earned just 11.4% per year, while the market returned 17.9% over the same period. That is a deficit of 6.5 percentage points, compounded annually. The average household, by contrast, earned 16.4%. The research confirms that overconfidence bias leads to excessive trading, which increases transaction costs and the probability of execution errors, eroding returns relative to a passive benchmark.
Market anomalies and the equity premium puzzle
Loss aversion provides a compelling theoretical explanation for the equity premium puzzle - the historically wide gap between stock market returns and the returns on safer instruments like Treasury bills. Because investors are acutely sensitive to losses, they demand a significant risk premium to hold equities. This higher required return is a direct consequence of the psychological tax imposed by the threat of price fluctuations.
When this bias is combined with frequent portfolio evaluation - checking returns daily or weekly - the result is what Benartzi and Thaler (1995) termed myopic loss aversion: investors who monitor their portfolios most closely are also the most likely to observe short-term losses and react emotionally, even within long-term investment horizons.
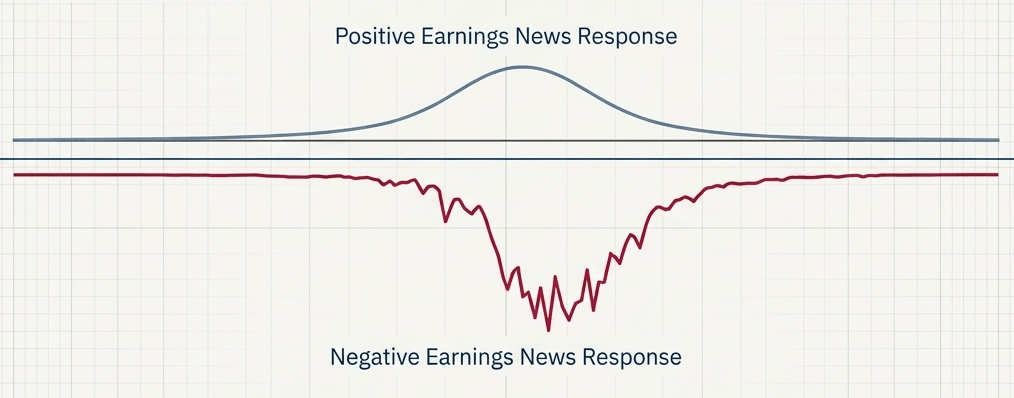
Market responses to news are also asymmetric. In environments with high measured levels of loss aversion, research indicates that the market response to negative earnings news is significantly more pronounced than the response to equivalent positive news. Selling pressure is amplified by an elevated emotional reaction to bad news, leading to rapid capital outflows and disproportionate volatility.
Current market sentiment and the amplification effect
Global investor sentiment reached its most bearish level in ten months, according to the Bank of America Global Fund Manager Survey conducted April 3-9, 2026. A net 36% of the 193 participating fund managers now expect a weakening global economy - a dramatic reversal from a net positive 7% expecting growth just weeks earlier, and among the sharpest single-month deteriorations in recent years.
This shift in sentiment produced a marked reduction in global equity allocation, which fell to a net 13% overweight from 37% in February - a collapse of 24 percentage points in under two months.
This cautious environment exacerbates loss aversion in a self-reinforcing cycle. When geopolitical tensions and macroeconomic uncertainty rise, investors become more prone to holding losing positions in hope of a recovery, while simultaneously hesitating to enter new positions that carry perceived risk. Capital becomes trapped in underperforming assets, preventing reallocation into sectors with higher growth potential. This is the emotional feedback loop that drives retail and institutional underperformance relative to passive benchmarks - and it tends to be most severe exactly when the opportunity cost of inaction is highest.
Practical strategies for overcoming loss aversion
Recognising loss aversion is the first step. Systematically countering it requires deliberate structural changes to how investment decisions are made.
Pre-committing to rules removes emotion from the equation. Predetermined rebalancing thresholds, automatic reinvestment plans, and rules-based selling criteria (such as stop-loss levels set before a position is opened) prevent emotionally charged decisions from occurring in real time. By deciding in advance how to act, investors bypass the amygdala-driven responses that distort judgment during market stress.
Reducing portfolio monitoring frequency is empirically supported. Research on myopic loss aversion demonstrates that investors who check performance less frequently - monthly rather than daily - encounter fewer perceived losses, make fewer reactive trades, and achieve better outcomes. If the investment case hasn't changed, neither should the decision.

Reframing losses as volatility, not failure, is a cognitive technique that aligns perception with reality for long-term investors. A portfolio decline is only a loss when realised. Unrealised drawdowns are, by historical precedent, temporary - for diversified, long-horizon investors. Building this reframe into a written investment policy statement makes it accessible during moments of market stress.
Using passive or rules-based vehicles - index funds, systematic strategies, or model-driven allocations - transfers decision-making authority away from real-time emotional judgment to an agreed-upon process. This is, in part, why passive strategies have structurally outperformed active retail investors over the long run: they are, by design, immune to regret aversion.
Working with a behavioural financial advisor - one explicitly trained in cognitive bias intervention, not just asset allocation - can provide the external accountability structure that many investors lack. The advisor's role is not just portfolio construction; it is interrupting the emotional trade.
The long-term compounding cost of emotional investing
The numbers above - an 848 basis point annual gap, a 6.5 percentage point deficit from overtrading - may appear modest in isolation. Compounded over a 20 or 30-year investment horizon, they are catastrophic to wealth accumulation.
An investor starting with $100,000 who earns the market rate of 10% annually for 30 years ends with approximately $1.74 million. An investor who, through emotional decision-making, earns 7.5% annually ends with approximately $874,000 - a gap of nearly $870,000 on the same starting capital. The difference is not a market outcome. It is a behavioural one.
Loss aversion is not a flaw in a minority of investors. It is a feature of human neurobiology, operating across retail and institutional markets alike. The investors who outperform over the long run are not those who feel less - they are those who have built systems that act despite how they feel.

Share now









Key takeaways
- The canonical loss aversion coefficient (λ ≈ 2.25) was established by Tversky and Kahneman (1992) in cumulative prospect theory; comprehensive meta-analyses report a mean of approximately 1.96 (95% probability interval: 1.82-2.10), with variation by methodology - some risky-choice contexts yield estimates as low as 1.3.
- Functional MRI research links regret aversion to increased neural activity in the medial orbitofrontal cortex and the amygdala - the brain's core threat-detection and emotional-regulation structures.
- The 2025 DALBAR QAIB report found the average equity investor earned 16.54% in 2024 versus the S&P 500's 25.02% return - an 848 basis point shortfall, the second-largest investor performance gap of the past decade.
- The Barber and Odean (2000) study of 66,465 household brokerage accounts found that the most active traders (≈75% annual portfolio turnover) earned just 11.4% per year while the market returned 17.9% - a 6.5 percentage point annual deficit; the average household earned 16.4%.
- The Bank of America Global Fund Manager Survey (April 3-9, 2026) - covering 193 fund managers overseeing approximately $563B in AUM - found a net 36% of respondents expect a weaker global economy, a reversal from net +7% growth expectations weeks prior; global equity allocations collapsed from a net 37% overweight in February to 13% - one of the most bearish readings in recent months.
- Myopic loss aversion (Benartzi & Thaler, 1995) demonstrates that investors who evaluate portfolios more frequently experience more perceived losses and are more likely to underallocate to equities, directly linking monitoring behaviour to long-term return erosion.
- An investor earning the market rate of 10% annually for 30 years on $100,000 accumulates approximately $1.74 million; at 7.5% - a plausible behavioural penalty - the same investor accumulates approximately $874,000, a shortfall of nearly $870,000 from identical starting capital.
Sources
- Tversky, A. & Kahneman, D. (1992) - Advances in Prospect Theory: Cumulative Representation of Uncertainty https://psych.fullerton.edu/mbirnbaum/psych466/articles/Tversky_Kahneman_JRU_92.pdf
- Brown, A. et al. (2024) - Meta-Analysis of Empirical Estimates of Loss Aversion (Journal of Economic Literature) https://www.aeaweb.org/articles?id=10.1257/jel.20221698
- DALBAR, Inc. (2025) - Quantitative Analysis of Investor Behavior (QAIB): 2025 Report Press Summary https://www.dalbar.com/press-release/investors-missed-the-best-of-2024s-market-gains-latest-dalbar-investor-behavior-report-finds/
- Barber, B. & Odean, T. (2000) - Trading Is Hazardous to Your Wealth: The Common Stock Investment Performance of Individual Investors (Journal of Finance) http://faculty.haas.berkeley.edu/odean/papers/returns/individual_investor_performance_final.pdf
- Benartzi, S. & Thaler, R. H. (1995) - Myopic Loss Aversion and the Equity Premium Puzzle (Quarterly Journal of Economics) https://www.jstor.org/stable/2118511
- Coricelli, G. et al. (2005) - Regret and Its Avoidance: A Neuroimaging Study of Choice Behavior https://pure.mpg.de/rest/items/item_2615172_3/component/file_2622686/content
- Bank of America (2026) - Global Fund Manager Survey, April 2026 (via InvestingLive) https://investinglive.com/news/investors-surveyed-in-early-april-were-most-bearish-in-10-months-bofa-20260414/
- Published 2026-04-27 19:56
- Modified 2026-06-11 14:59

-
Redaction